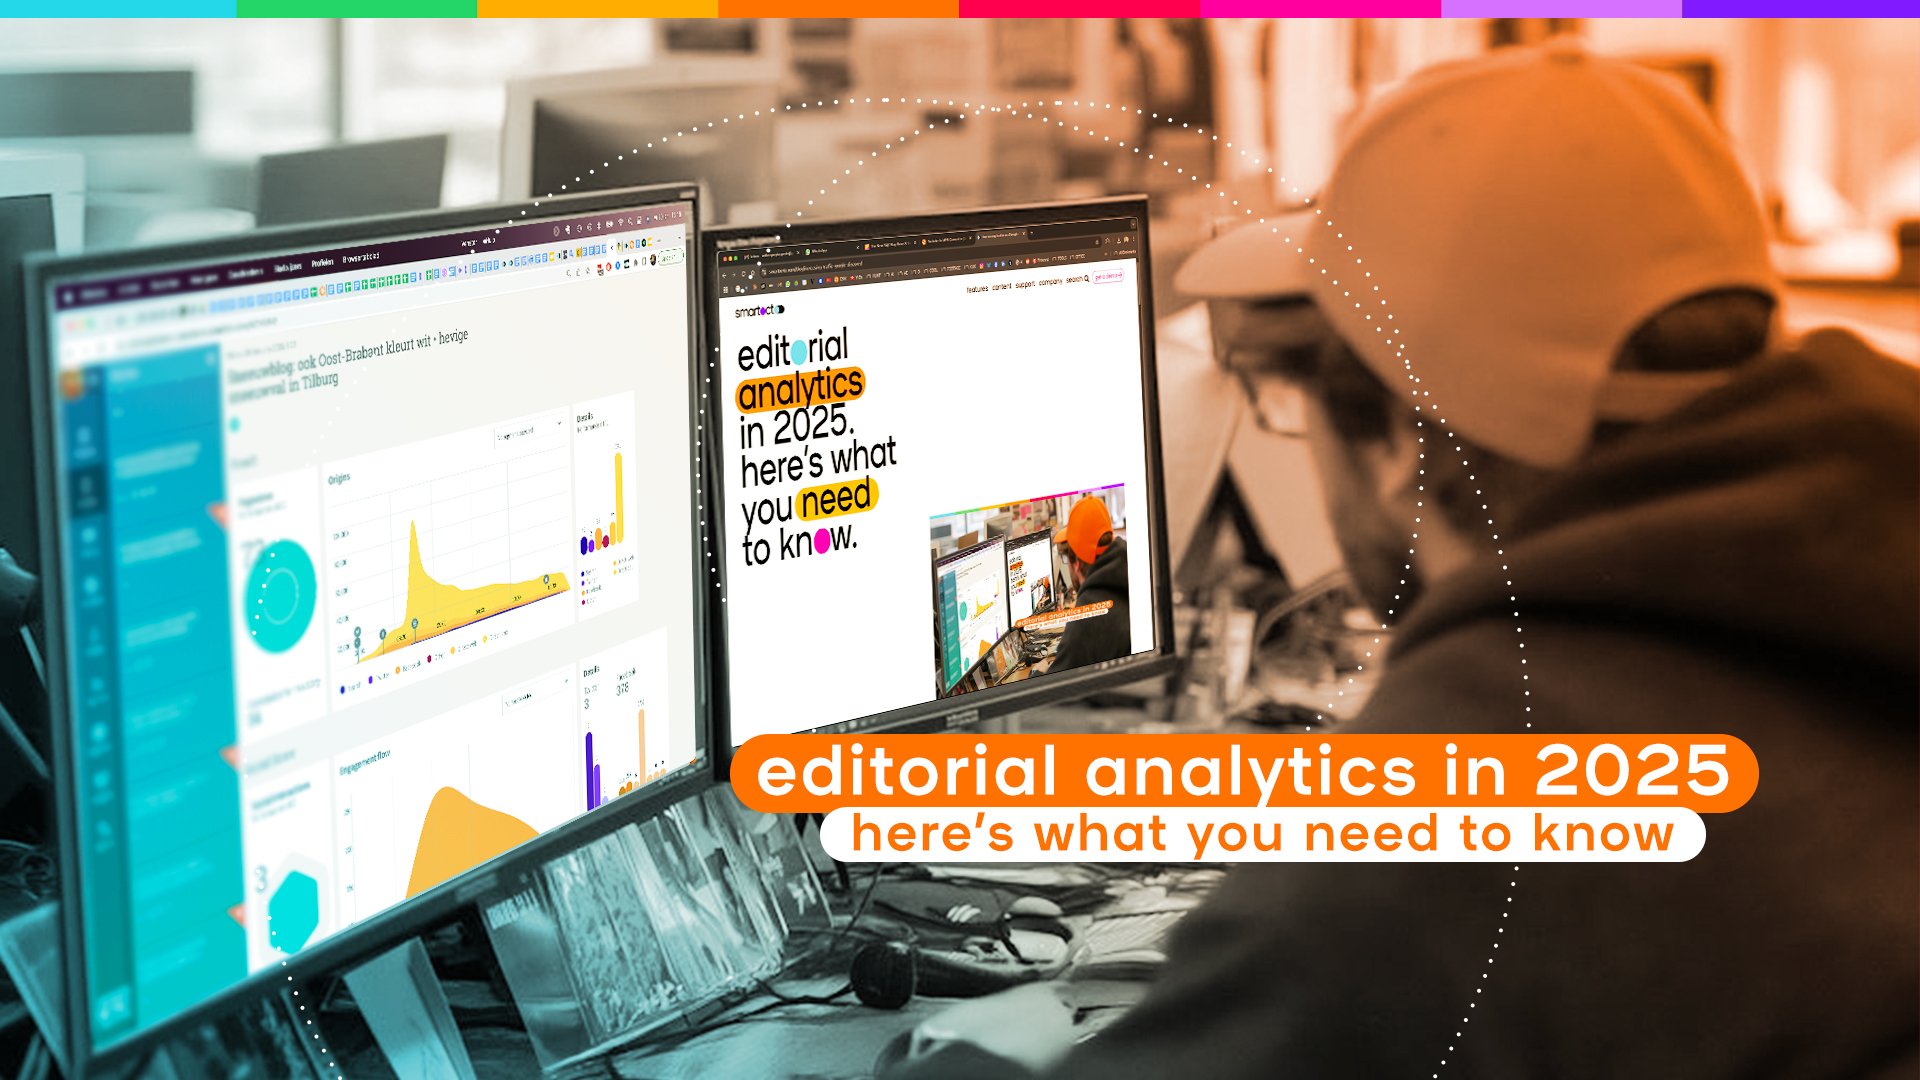
Ten years after the founding of smartocto seems like a good moment to take stock of where we stand. What should an editorial analytics solution look like in 2025?

We think they should be organised around five key requirements: to be user-friendly, responsive, goal-driven, customisable and actionable. Now the technology has caught up with the vision, analytics should be part of the story life cycle: there to help you improve, iterate and optimise.

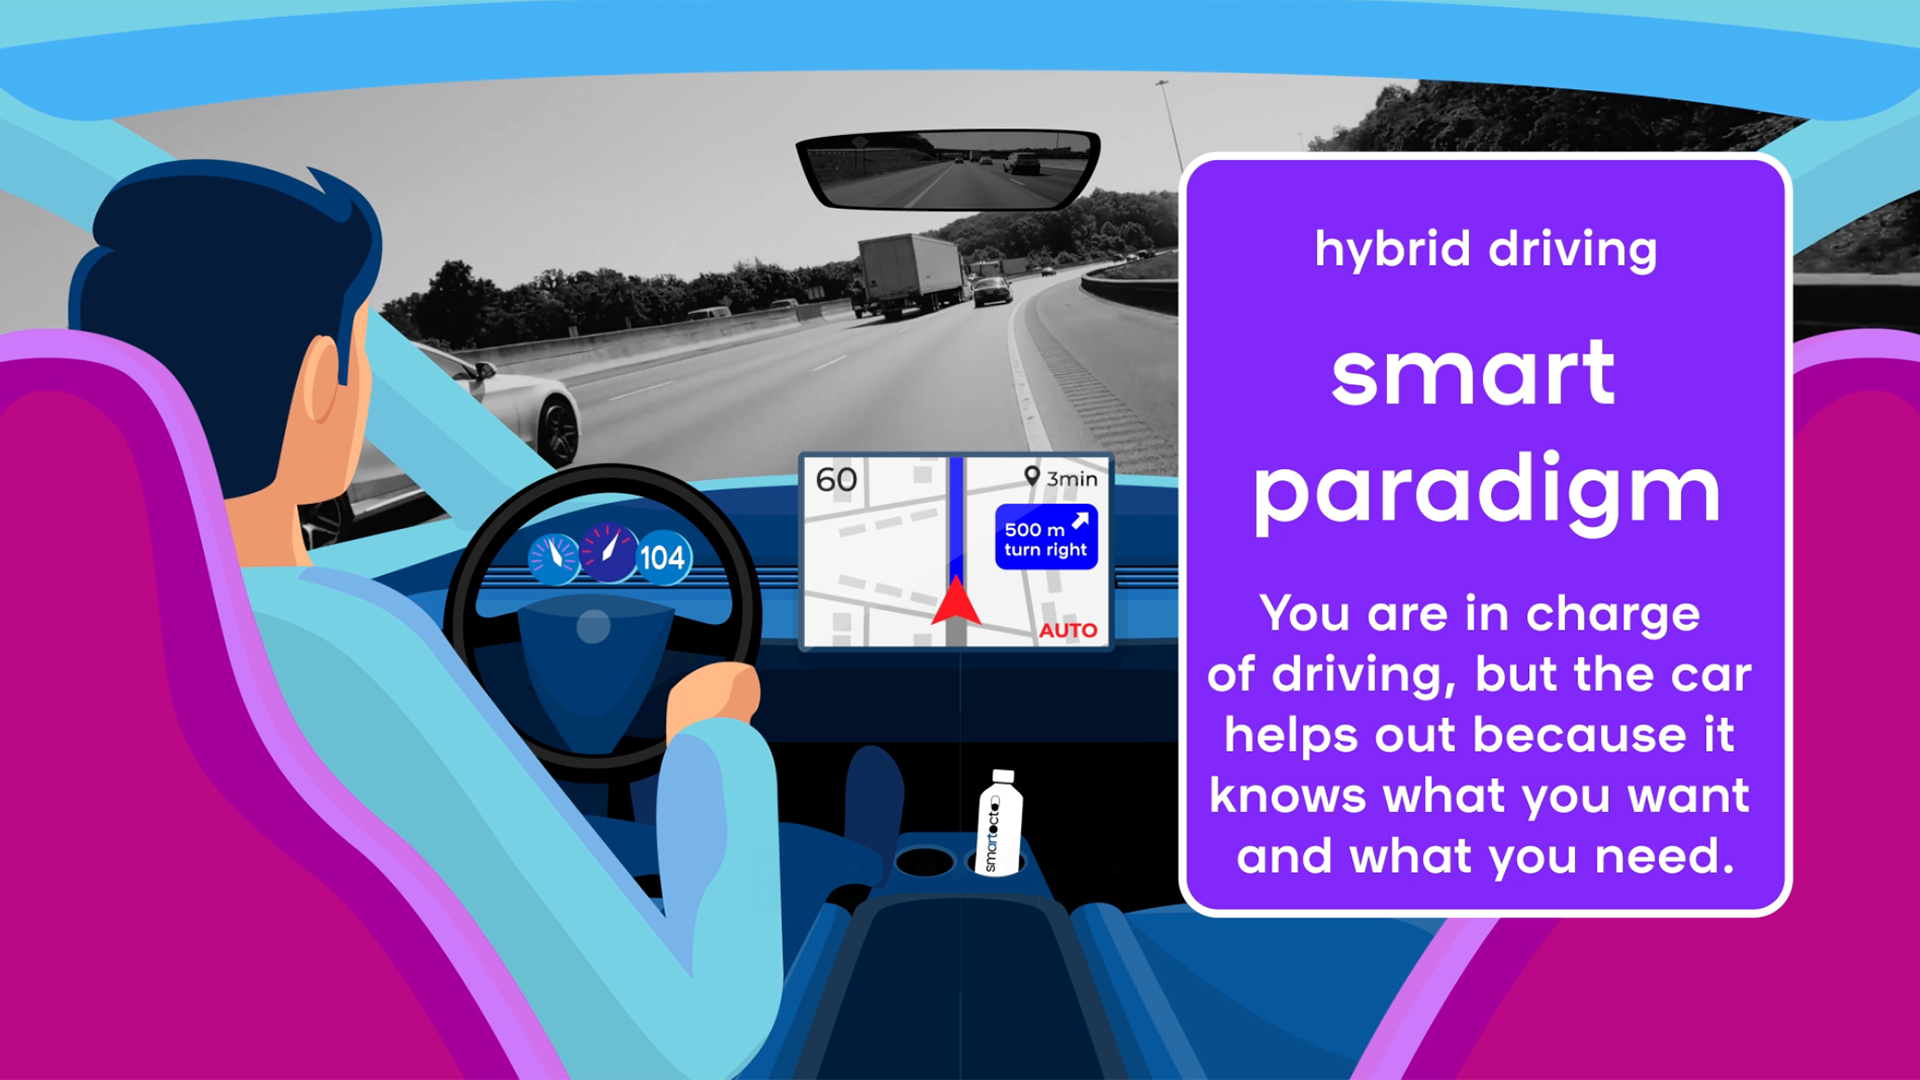
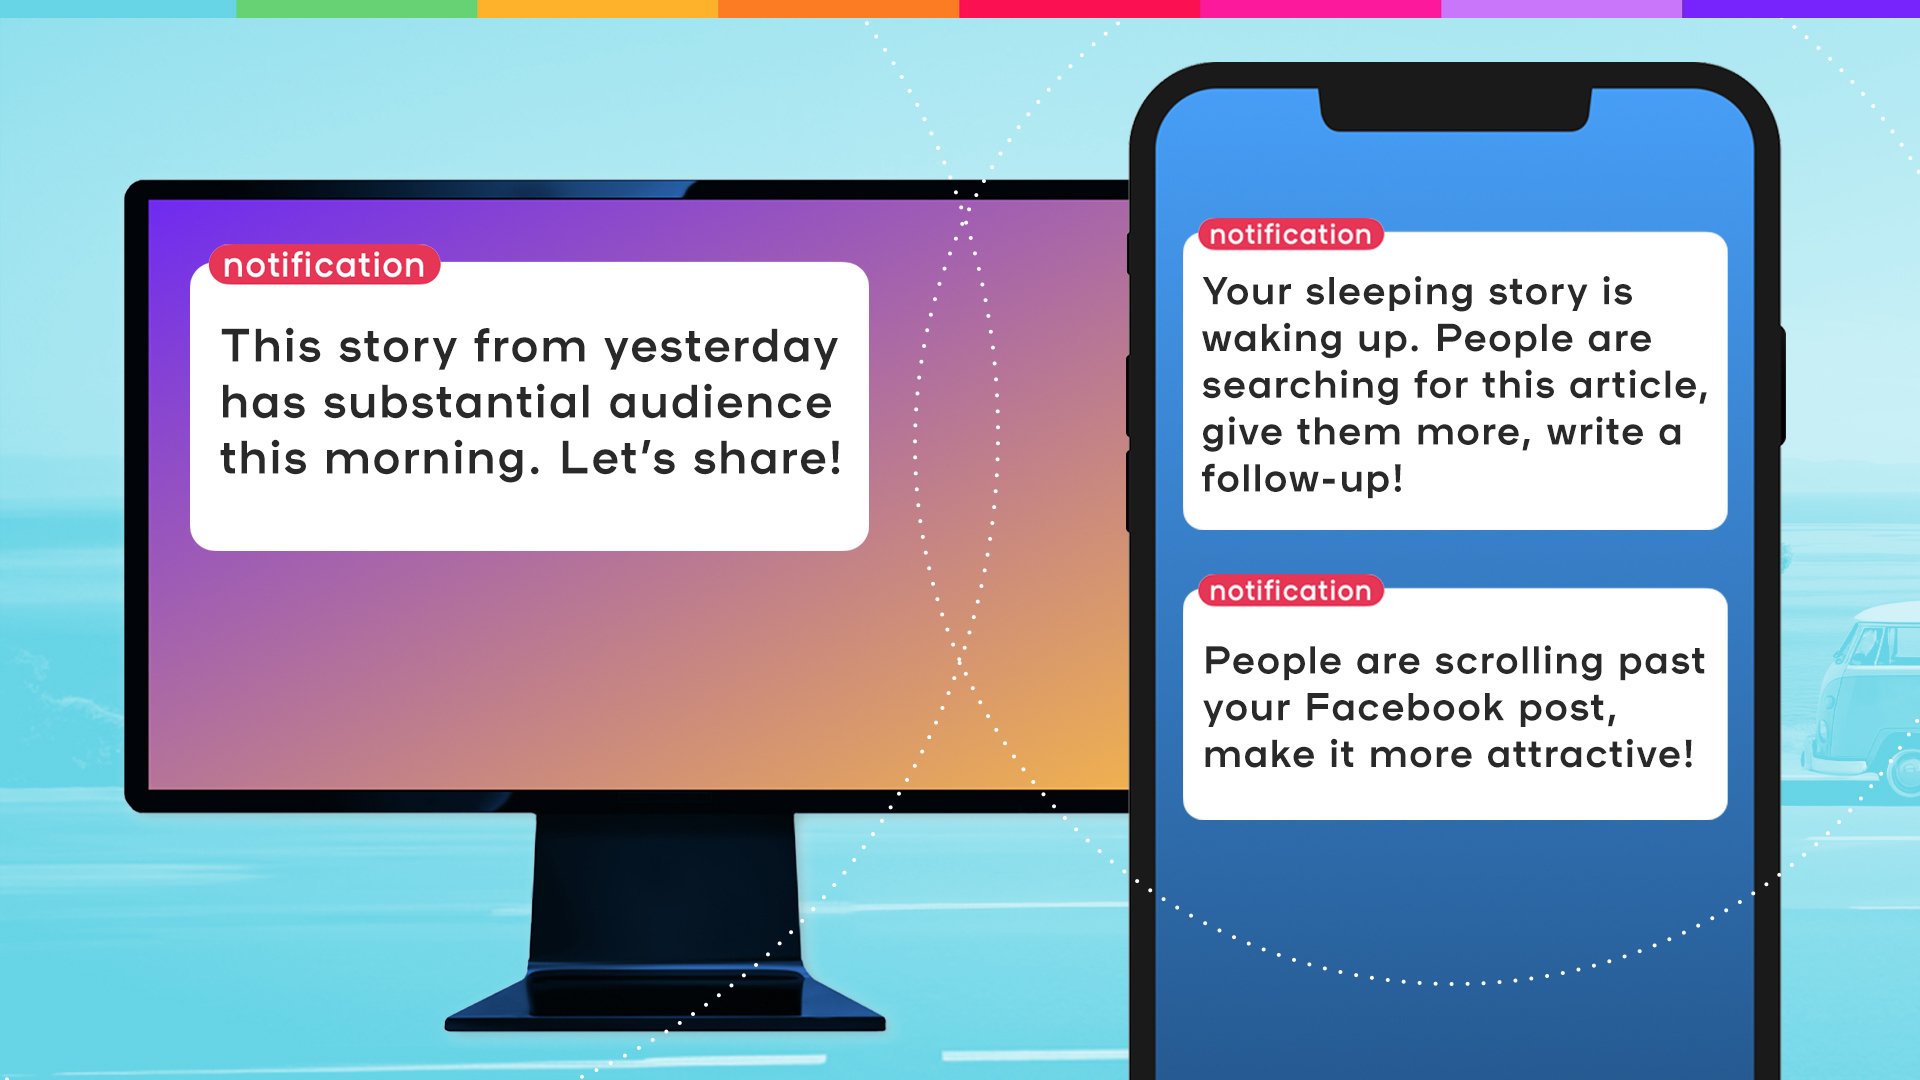
Data is just one part of the process. The other part is the newsroom’s goal. That space between leaves room for insight, notifications and actionable prompts. This is where the real value is - and this is what any analytics solution worth its salt should be doing in 2025.

Is it User-Friendly?

There’s absolutely no reason why editorial analytics in 2025 should feel like a chore. This isn’t 2005. It’s not even 2015. We’ve come a long way.

  1. A better user experience means you’re more likely to use your editorial analytics tool, thus getting better value for money. And, the more you use something, the better you’ll get at using it, thus increasing efficiency even further.
  2. Data can be presented in a way that’s simplified, but never simplistic. You don’t need all the data in the world, you just need the information pertinent to you and your role. If you know you’re getting the curated numbers you need, it won’t feel like a slog.
  3. And, at the risk of labouring the point even further, if data is presented in chart, quadrant or is otherwise clearly visualised, you’ll be able to better discern patterns, tendencies or sudden changes in performance.

The onboarding process with smartocto has gone smoothly for me. Once all the tracking integrations fromDPG Media were properly configured, we were able to roll out the live dashboards effectively to our editors. We can communicate quickly with our team, and within DPG Media, we also have efficient data communication channels.

Twan Bovée editor-in-chief @ Sportnieuws.nl, DPG Media

Q U I C K T I P : If this is all still sounding a bit overwhelming, start simple. For many newsrooms, the key metrics remain REACH, ENGAGEMENT and CONVERSION. Pay attention to the insights that help inform understanding of those key points.

There should be lots of support for whichever editorial analytics provider you’re using.

As the Head of Customer Success, I'm very proud of how our solution has developed over time. The feedback we get is that it’s easy to navigate through the tools, to understand the data, and to know how to act on it. That’s how we envisioned the client experience should be from the start.

Alex-new

Alexsandra Radivojevic success manager @ smartocto

Is it Responsive?

There’s a reason why A/B testing has proven to be an indispensable feature for many of our clients. Those utilising big screens and realtime analytics in newsrooms know that even small, seemingly insignificant changes can actually make a big difference. But, for this to work, both you and the tool needs to be responsive. That’s where we come in.

  • Waves - customise the big screen to ensure it fits with your specific needs, and reflects the information you want your people to have access to
  • Tentacles - helps you optimise your homepage with A/B headline tests. See which paragraphs show churn and optimise (you can even get AI suggestions for alternatives)

-> Want a refresh on A/B testing? Read this client case or recap the basics

Is it Goal-driven?

Your editorial analytics tool should be firmly anchored to the specific goals and aims of your newsroom. What’s your business model? Are you trying to build membership? Boost ad revenue? Expand into new verticals or markets? Reduce news fatigue and boost engagement? What are your KPIs? Analytics should, fundamentally, help you to isolate and highlight the areas where improvement is possible - as well as where best-practice can be replicated.

Q U I C K T I P : if you want to build a sustainable relationship with loyal readers, it’s important to focus on the articles that your loyal audience values most. Those don’t necessarily have the most pageviews. A good data analytics tool shows you in reports which topics, user needs and formats are most popular among your loyal audience (visitors who are habitually highly engaged). Once you know this, our Real time dashboards and notifications can help you to improve content in a way that’s proven to be of value to this important audience group.

Mini Case study: alleviate news avoidance with attention to analytics

The flip side of loyalty is news avoidance - and it’s a worrisome issue. In our recent webinar, Dmitry Shishkin addressed this. He also reiterated that it’s absolutely essential to embrace analytics if you want to understand what’s happening (and you should want to - you can’t manage what you don’t measure). Engaged (and loyal!) readers are not, after all, news avoiders. There’s a lot to learn from success as well as failure:

  • Where is news being ‘avoided’ in your organisation?
  • Which topics, user needs or formats are performing best?
  • Which are performing the worst?

The outcome of these questions can - and should - be folded into your strategy, both in terms of commissioning, but also with regards to distribution and optimisation of your articles and content.

Q U I C K T I P : With our Insights tool, you can generate a Quadrant report which will help you see at a glance where things are doing well - and where they aren’t.

Based on this, there are six strategies you can instantly deploy.

Is it Customisable?

Your audience engagement manager doesn’t need the same information as the editor of your sports section. Reports can and should be tailored to each role or department.

The key question:

-> What information do you need to iterate and improve?

We’re starting the year as we mean to go on - with a series of blog posts that address how analytics interplays with different newsroom roles. The first two are out, watch this space for more…

-> The Data Analyst

-> The Audience Engagement Manager

Is it Actionable?

For us right now, the most important part of editorial analytics is decision making.

Erik van Heeswijk, CEO @ smartocto

Erik van Heeswijk CEO @ smartocto

Smartocto is perhaps best known for its actionable notification system, so this is an area we continue to invest heavily in - and AI plays a big part in that.

In order to make editorial analytics actionable - and make them useful - it’s not enough to think solely about data. You have to also think about your goals - and the actions you need to take to reach them. AI helps draw a line between the two.

You may have heard us say this before, but it’s helpful to compare AI-driven editorial analytics solutions with driving. Just as the driving experience has been enhanced by metrics, it hasn’t gone all the way to driverless systems. Instead we have arrived at a hybrid solution: the driver is in control, but aided by notifications and suggestions from Google Maps or TomTom or Waze.

The fundamental point here is that in order for Sat Nav to work, it needs your input to tell you where you want to go.

In editorial analytics it’s the same. When you align available metrics with your newsroom’s goals, you get a solution, not just a report. These might - as is in the case of smartocto - manifest as actionable notifications that ping to your phone or laptop. What they fundamentally seek to do is to use past data to inform improvements to ensure that ‘future you’ does better.

Want a quick recap?

Editorial analytics are now more than numbers.

2025 will see us occupy the hybrid driving space - lots of available information, for sure, but you should only need to deal with the stuff that’s directly relevant to you and your mission. AI remains at the core of how we’ll deliver this - but our standpoint on how this coexists with the human newsroom remains the same: AI should function in a supportive, not omnipotent capacity. It’s there to automate and optimise things that can be automated. Which leaves you, the human editor, to drive your creativity, vision and execution.

Remember: keep it user-friendly, responsive, goal-driven, customisable and actionable. If your current solution doesn’t tick those boxes, get in touch. We’d love to be your dashboard.