Turning data into insights
Smartocto Insights is in perfect sync with every major publishing business model. With the help of our unique analytics solution, you can map the patterns in your audience behaviour and influence their actions. It's all about turning data into insights.
Inform
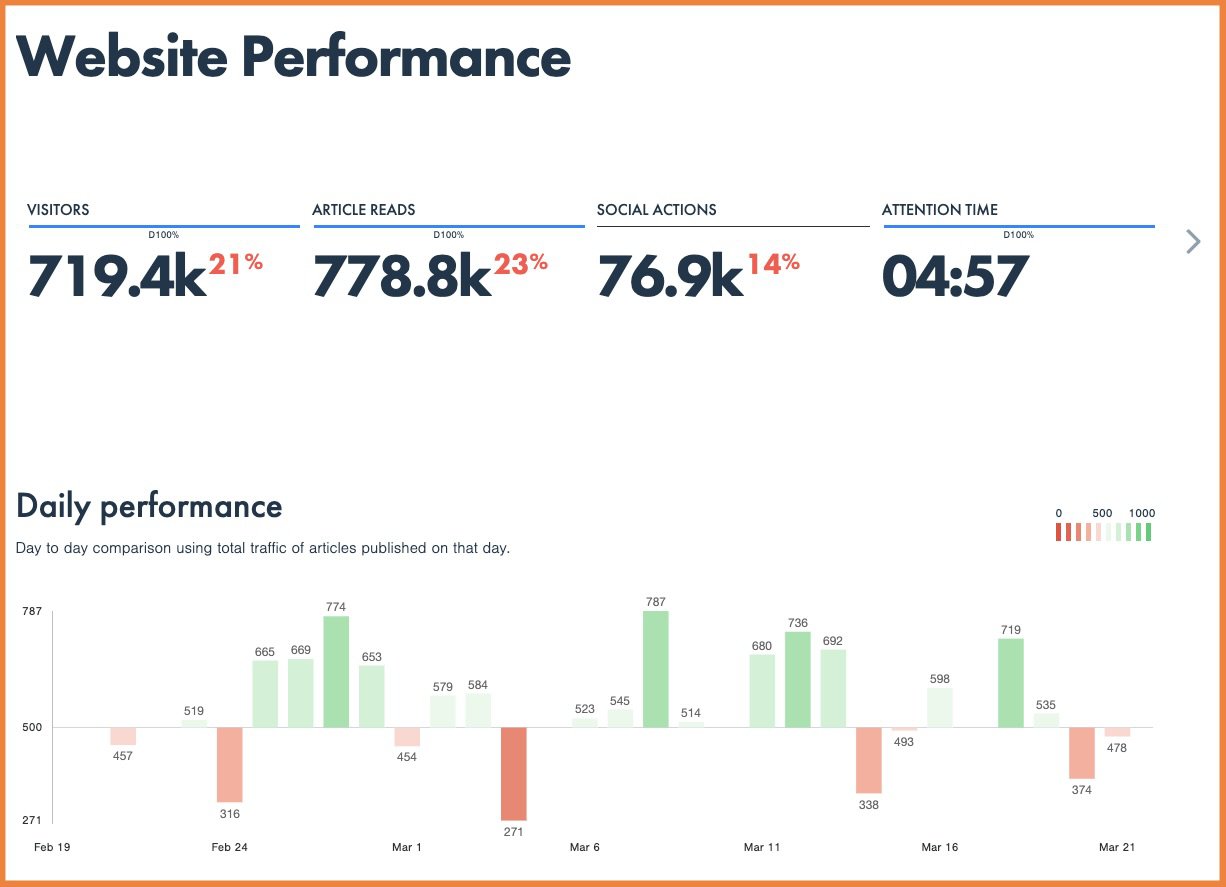
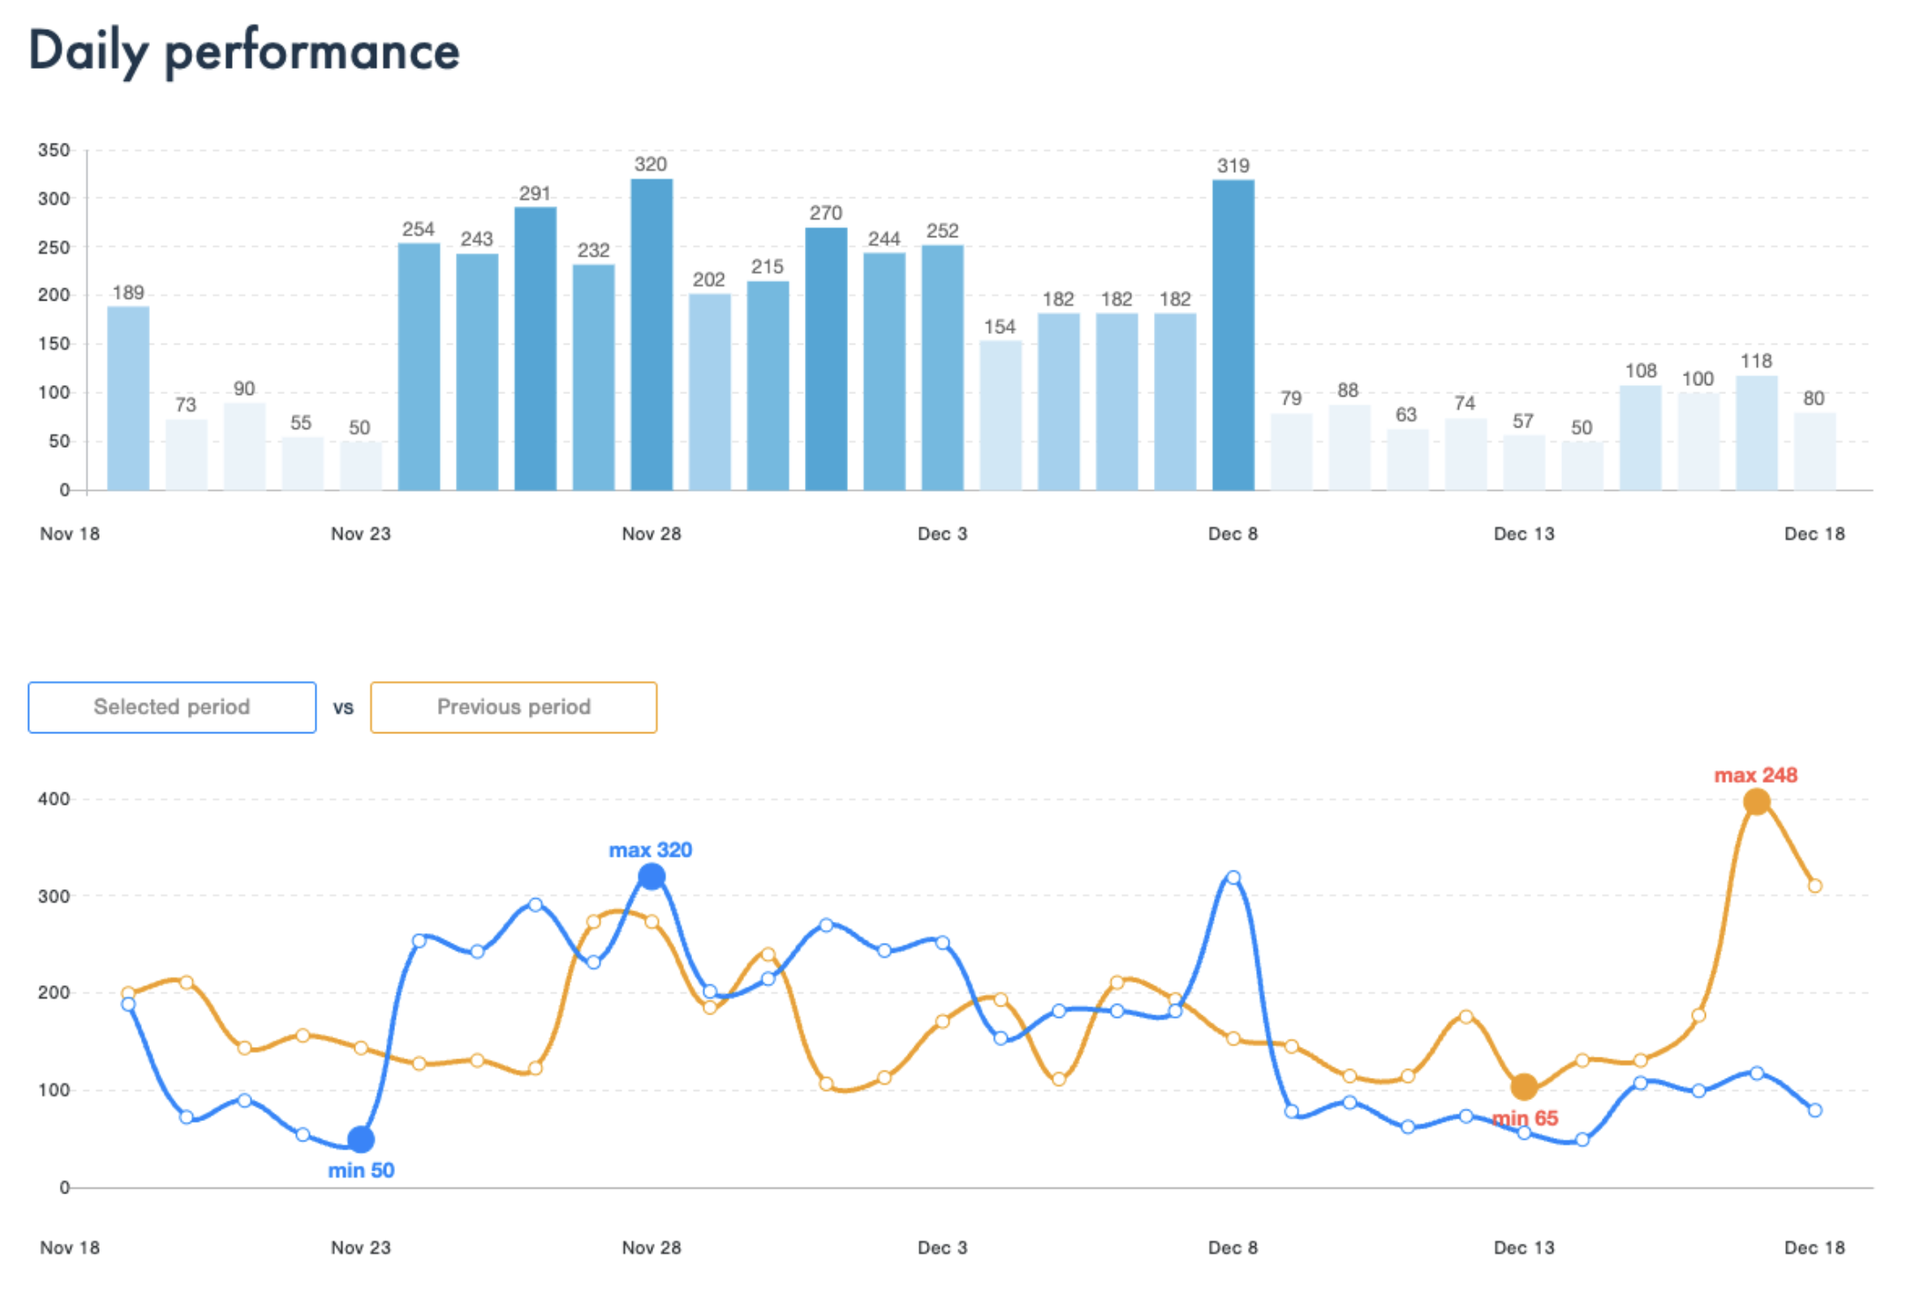
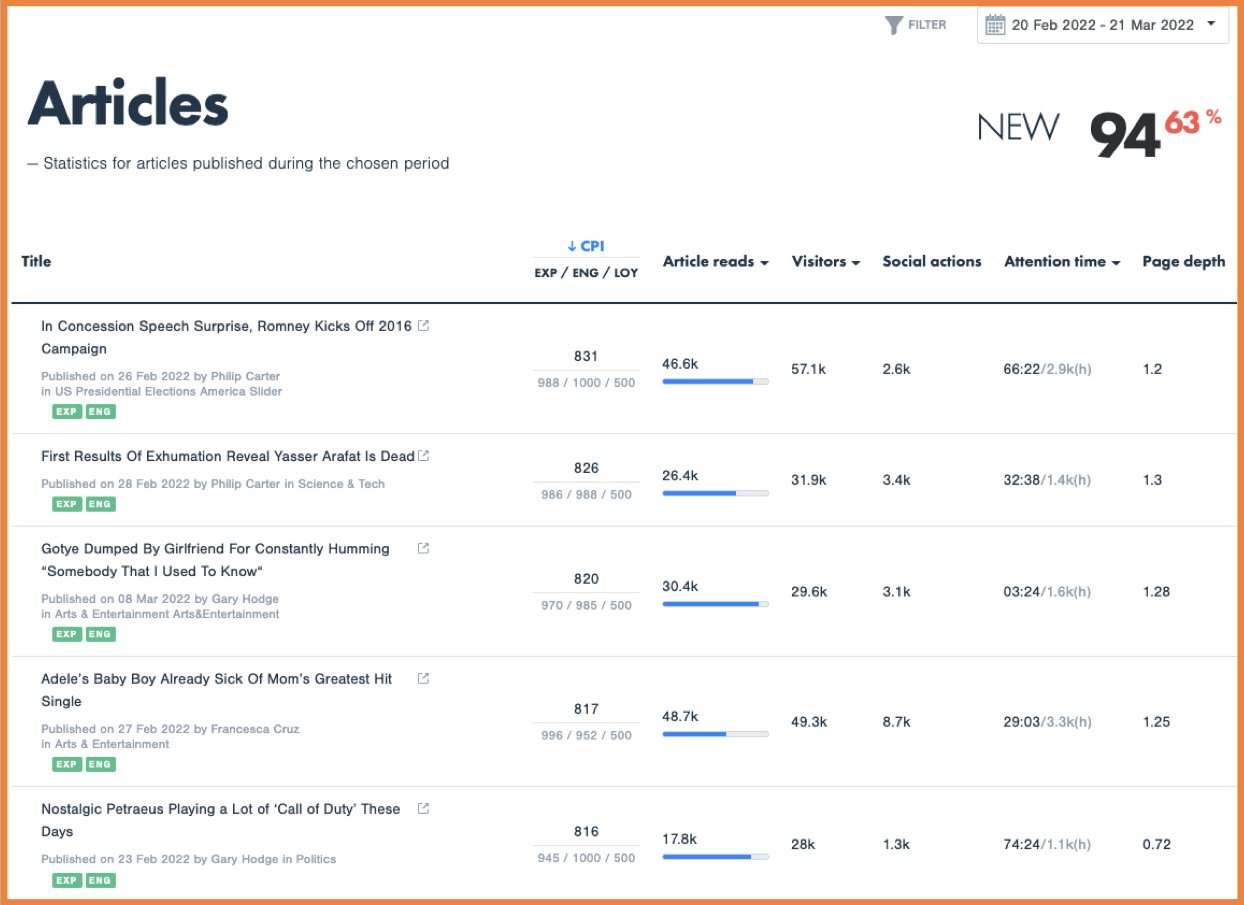
We measure real audience behaviour and content performance with unrivaled precision thanks to our advanced metrics.
We will measure...
- Article reads
- Attention time
- Read depth
- Visitors
- Social actions
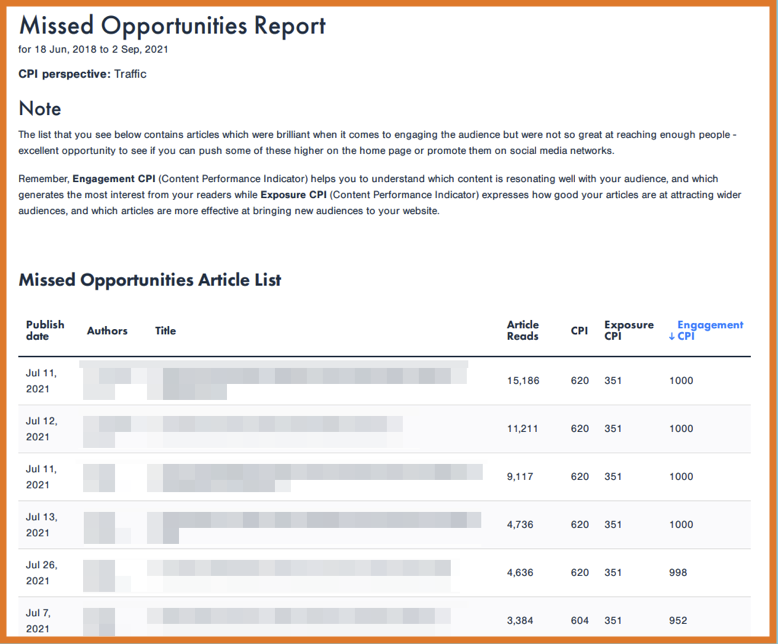
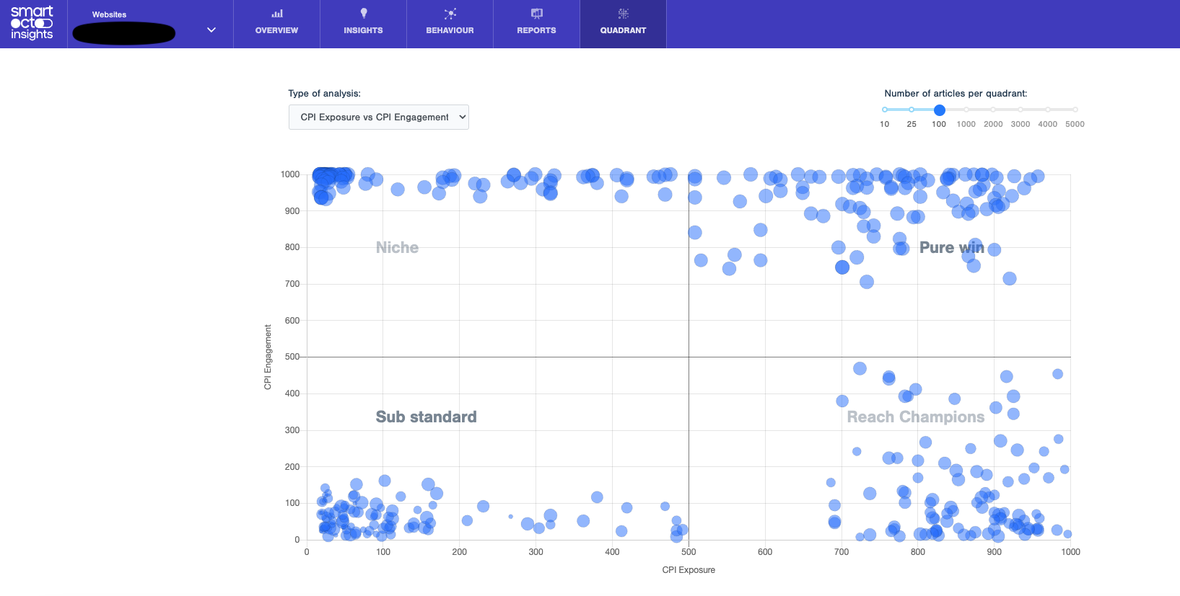
- our unique Content Performance Indicator based on exposure, loyalty and engagement