The Quadrant Model has already been available to a select group of clients for a few weeks. “We wanted to have some initial feedback to learn what would be the most valuable for our users”, Dragutin Miletic, co-founder and CTO at smartocto, says. “We’re now excited to roll out this feature to all clients who are subscribed to the smartocto Insights part of the tool. They won’t need to do anything: this additional feature will simply appear in the menu bar at the top.”
There won’t be any additional costs for users either. “All the data necessary to provide a quadrant analysis has already been collected and processed”, Dragutin explains. “As soon as we start to collect feedback we will iterate on the development and improve the model.”
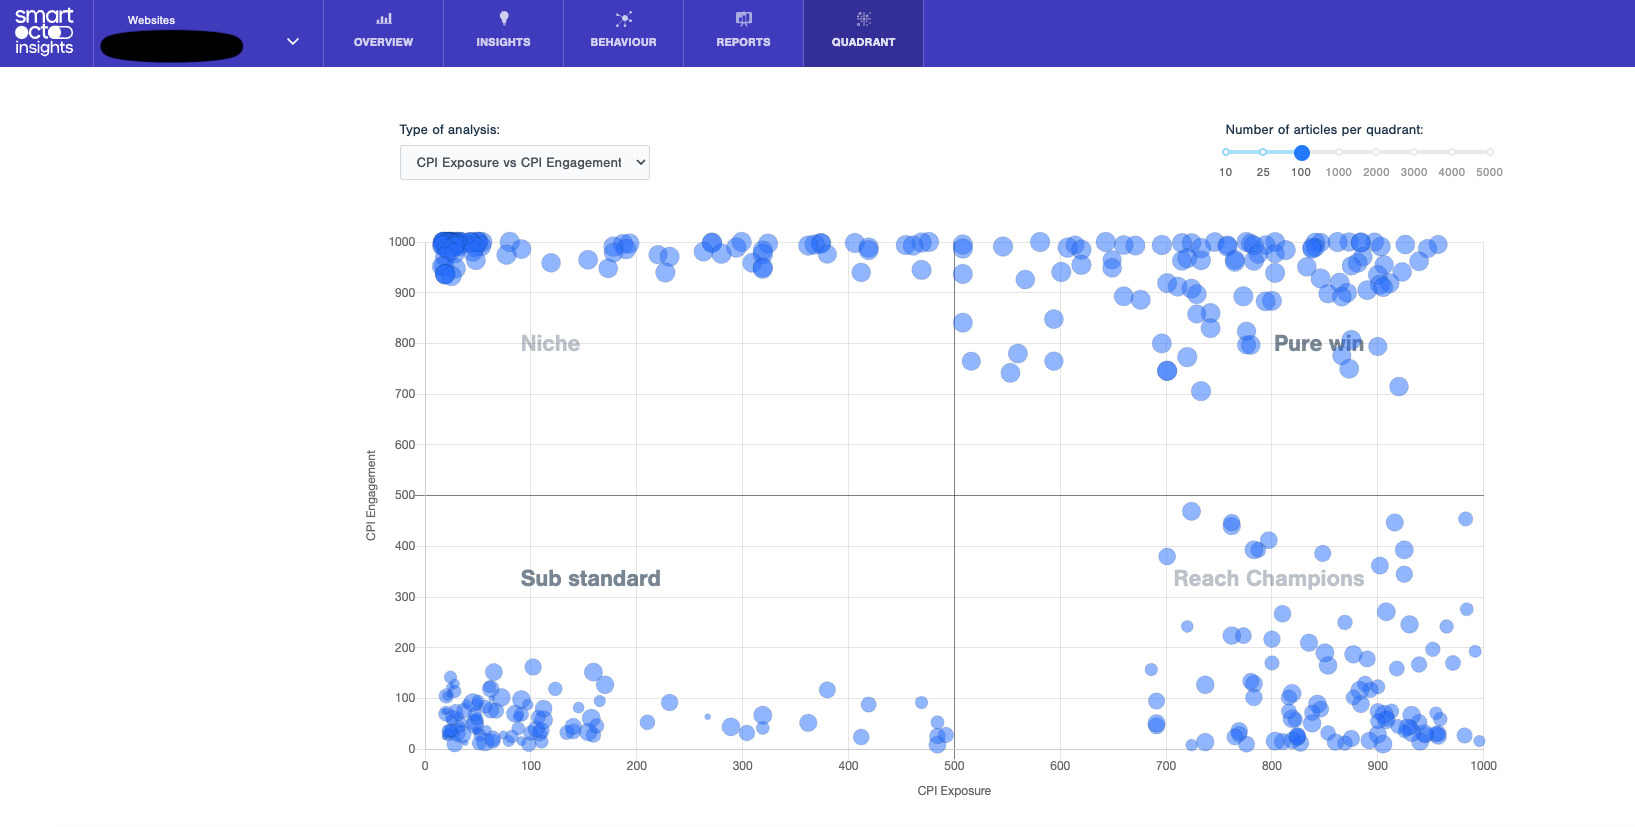
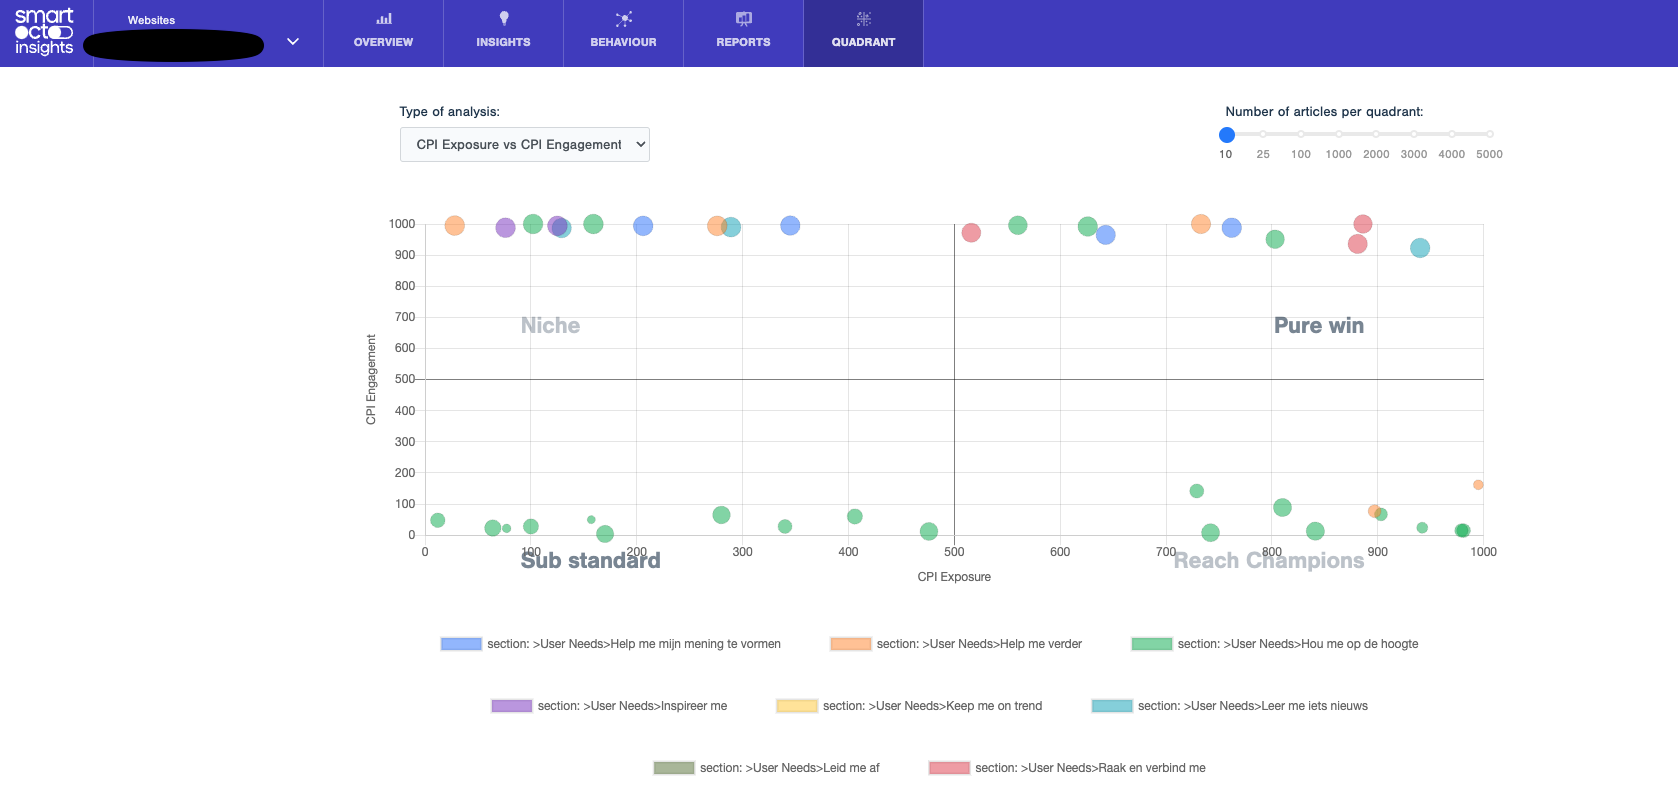
Once users have had a chance to work with it, smartocto may offer further tutorials and support depending on user feedback. That’s the way smartocto normally works with new releases, Dragutin explains: “The user experience is intuitive and customers utilising Insights already know how the quadrant looks like, because we have presented our topic analysis in this way for quite some time. The chart is pretty similar, but now media outlets can see the value on the article level. If you click on any dot in the quadrant, you’ll find further details and insights about that article.”
Dragutin Miletic says customers can of course ask questions: “At this stage, we’re eager to gather use cases and discover the types of analysis clients would like to perform. This will help us to continue to improve and refine this feature.”