Since October last year, smartocto users have had the option to test images. Many clients have started utilising this feature. The question is: what is the effect?

In order to work out if and why image testing is worth your time, a spot of data analysis is required.

The test

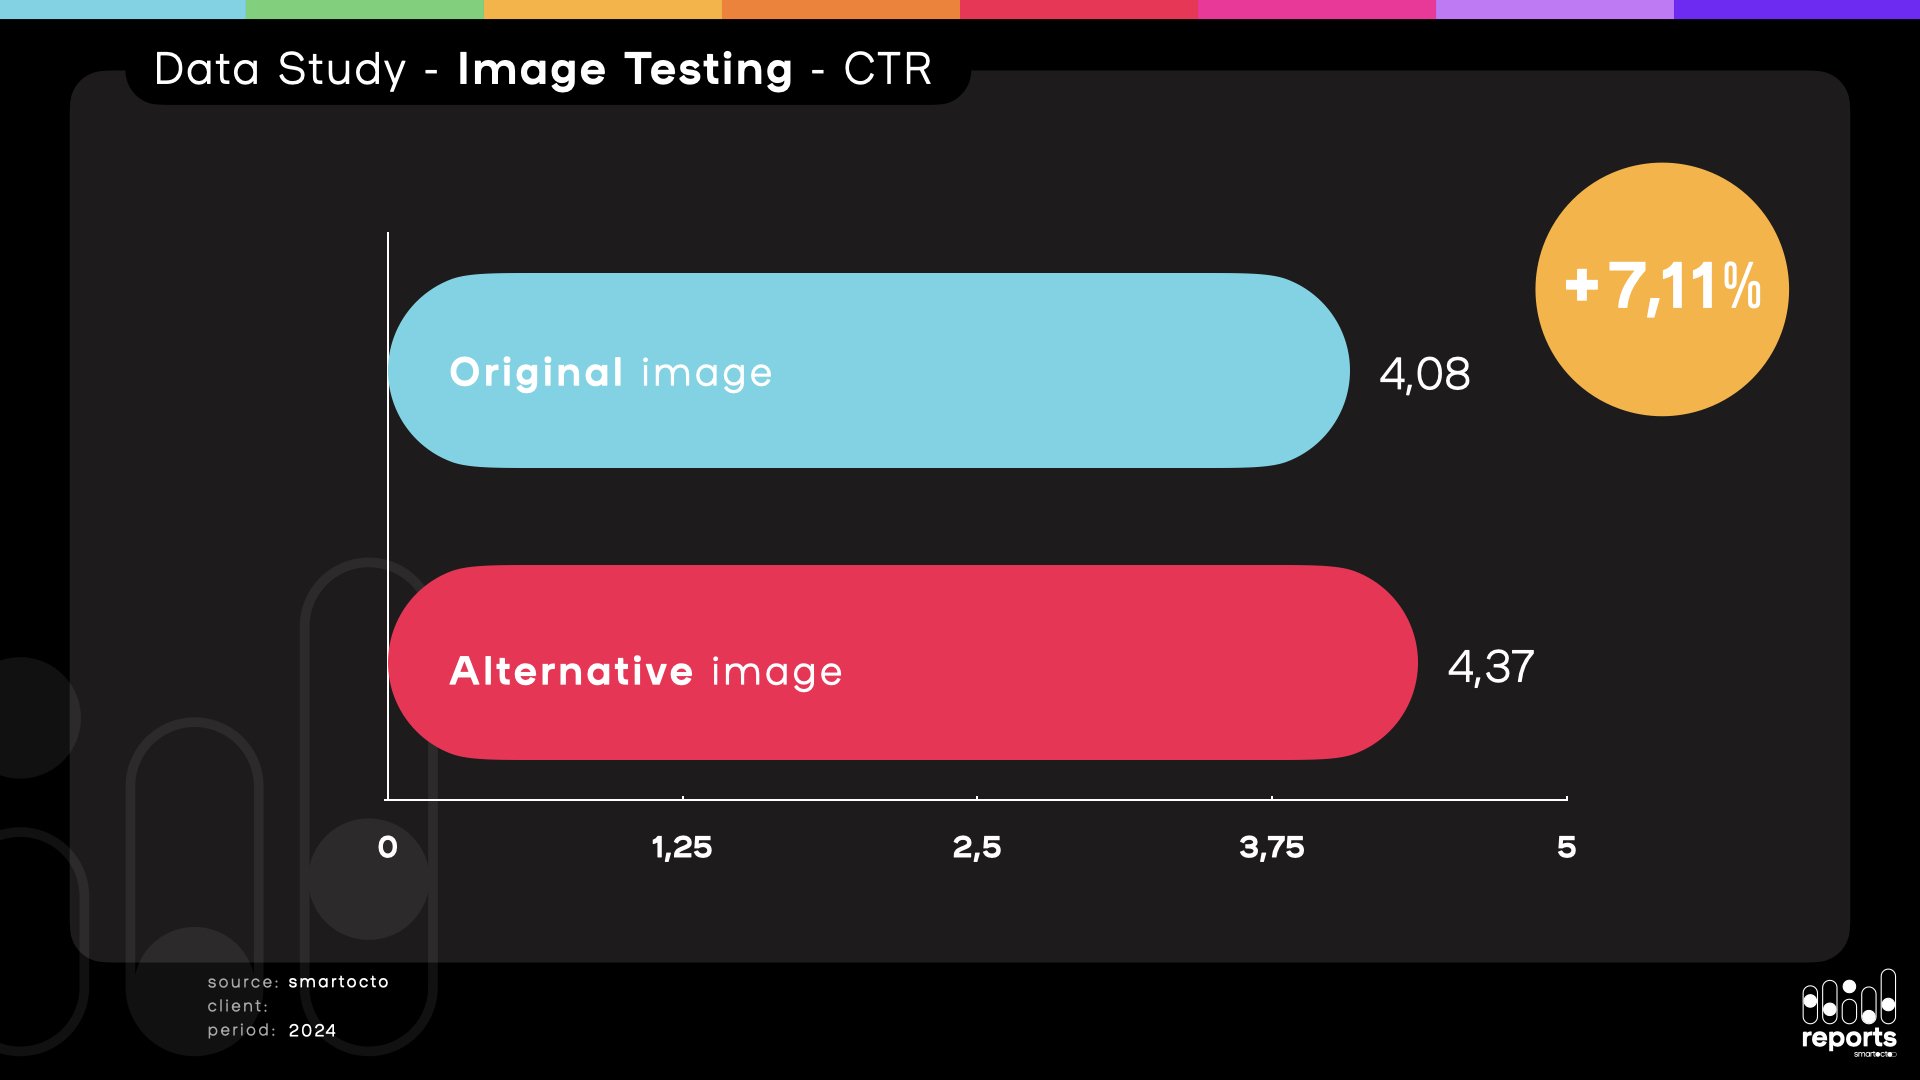
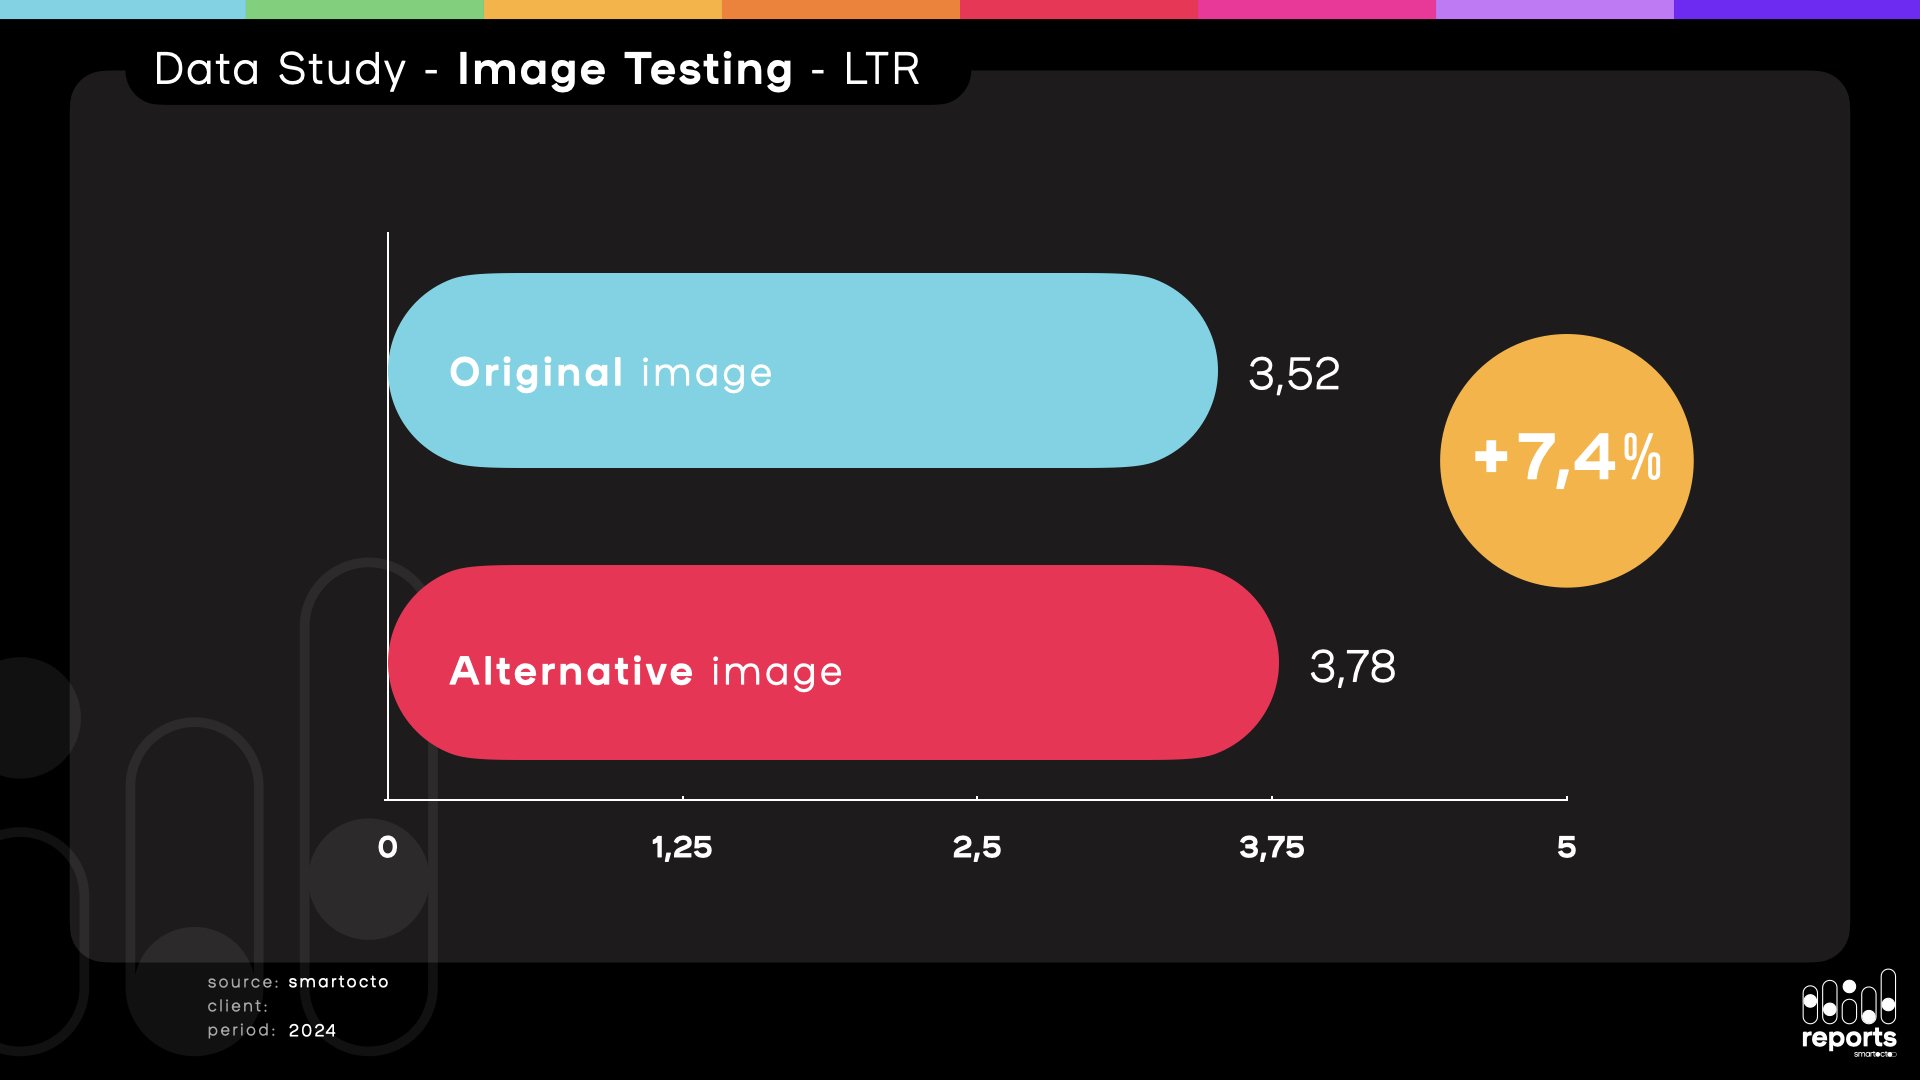
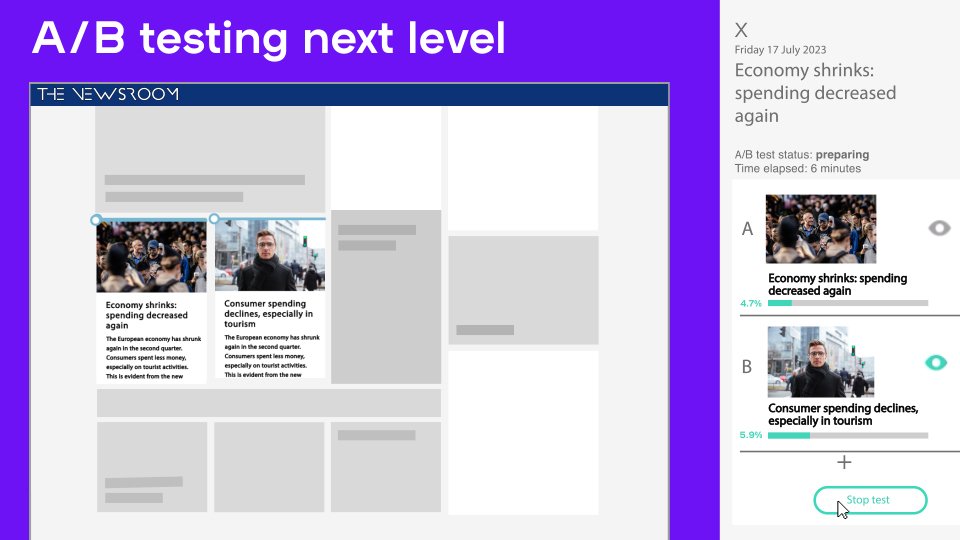
To do this we use A/B tests, where one part of the audience sees Image A, and another part sees Image B. Within a short period (perhaps as brief as 10 minutes, depending on the number of visitors), our feature Tentacles calculates which article is clicked more frequently and whether those visitors stay on the page for at least 10 seconds (loyalty clicks).

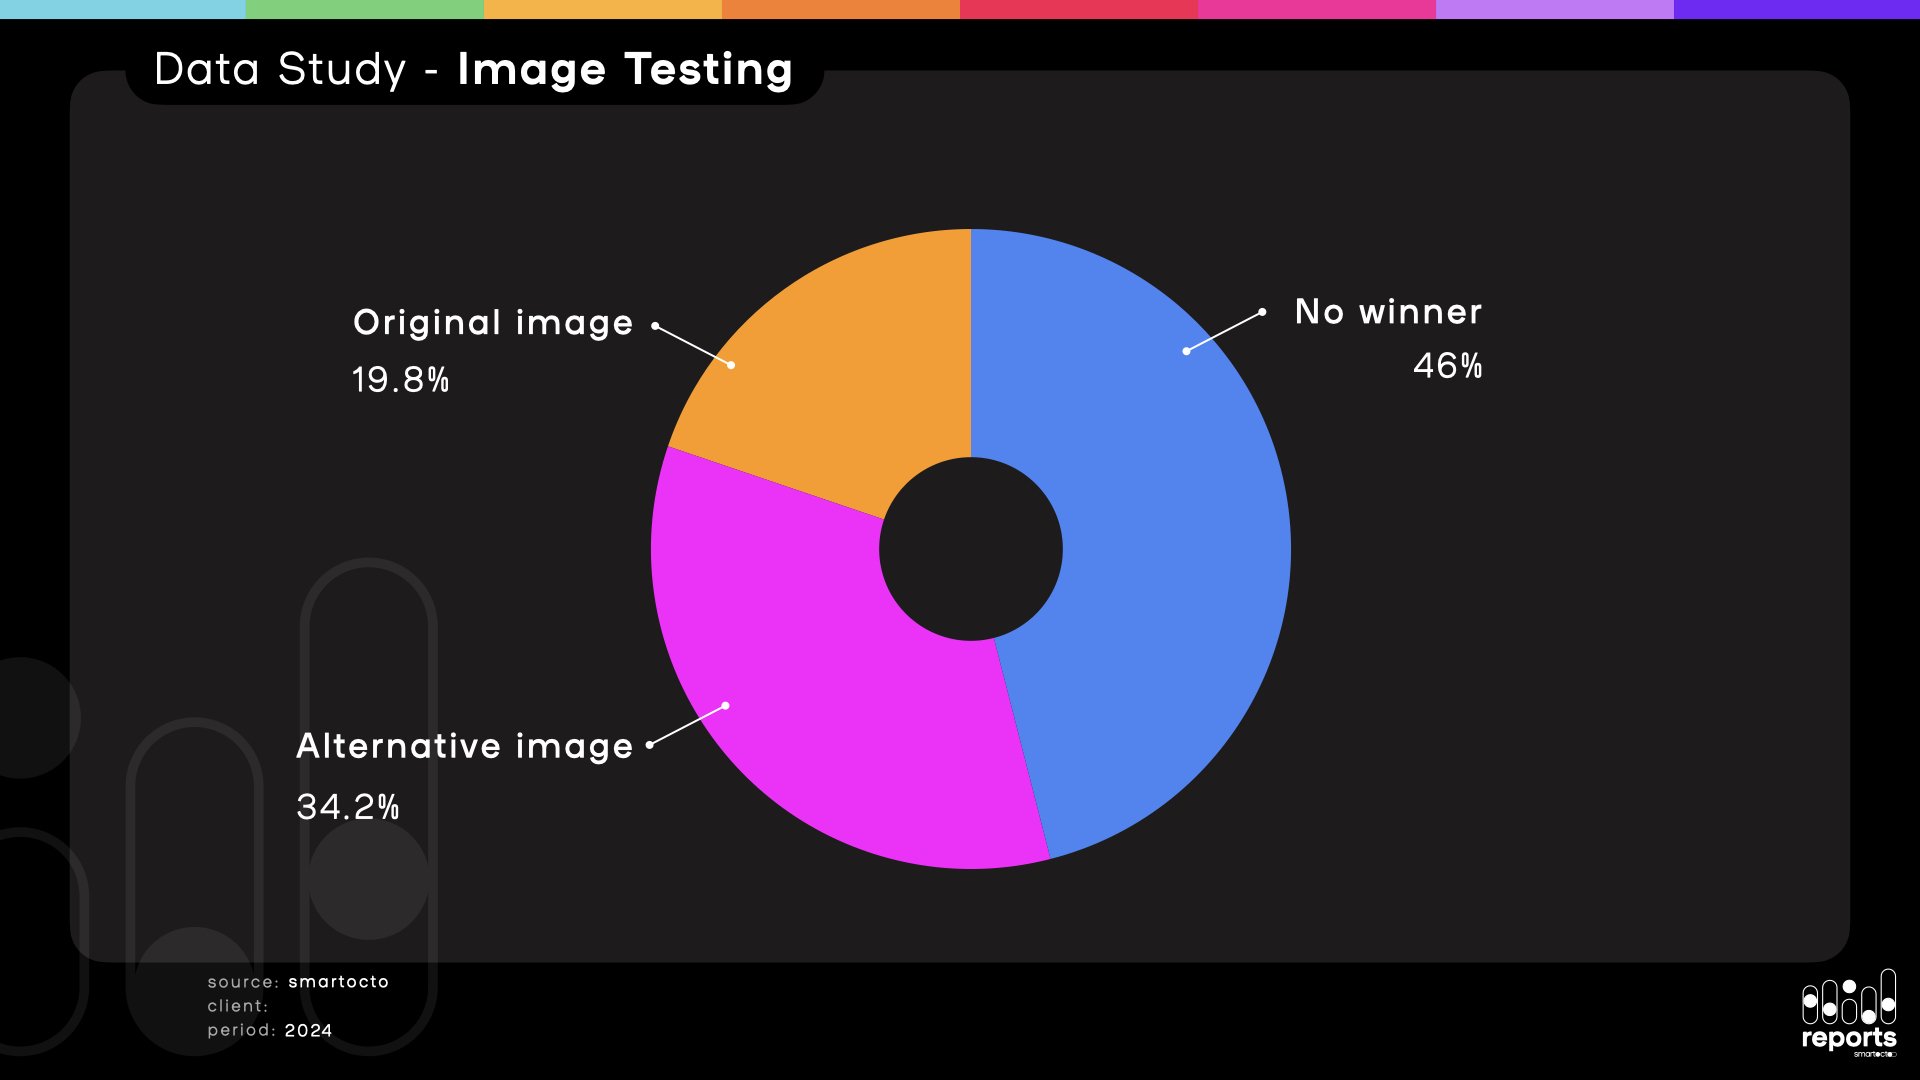
  • We analysed 3,260 tests across 26 brands
  • In more than half of the cases, there was a clear winner
  • When no clear winner emerged, the original image remained
  • When a winner did emerge, it was usually the alternative image (B, C, D, or E) that won
  • In most cases, only two images were tested

The result: CTR gets higher with image testing

In order to calculate the effect of choosing the best image for an article, we looked first at the Click Through Rate (CTR). How many people on a site click on the article when Image A is present, and how many do so when Image B is present?

Here are the results: the article with the winning image has a CTR of 4.34%, whereas the original has a CTR of 4.08%. That’s an increase of 7.11%. We observe a similar difference in the loyalty CTR.

From here, we can drill deeper and look at the Loyalty Click Through Rate (LCTR). How many people are loyalty clickers, meaning they don’t leave immediately after opening an article? This helps us to further understand where an image is helping drive engagement and loyalty.

By the way, the effect is even bigger when you do headline testing. Check out this data study and find out how AI can assist in headline testing.

Why is the alternative image often more popular?

Smartocto’s chief artificial intelligence officer, Goran S. Milovanovic offers a few possible explanations as to why the alternative images in these tests perform better:

  • “One possible reason is that editors mainly test when they are not satisfied with the original image for an article. They turn to an alternative because they think it might perform better, so often it does.”
  • Goran also suggests it might be related to the speed of editorial work: “It may be related to the speed of editorial work. Journalism is a fast-paced profession. I can imagine that editors do not always have time to immediately choose the best photo. Or the best image might not be available right away. In such cases, it is convenient to test a photo instead of replacing it.”

The two major takeaways

  1. Broadly speaking, there’s no downside to performing an image test: if you expect to get 100,000 clicks on an article, testing the image could result in 107,000 clicks. This does not apply to every article or every photo, but it represents the average effect. This average accounts for the fact that in 46% of cases, no winner is determined. The practical conclusion is that it is always worthwhile to consistently perform A/B tests, as there is nothing to lose. Articles frequently perform better, but never worse.
  2. Newness piques interest. The purpose of image testing is fundamentally to optimise the user experience, so that readers stay on your site for longer, and read more. Roy Wassink, insights manager of DPG Media makes a remark: “Some visitors return to a site multiple times a day. They might see an interesting article but have not clicked on it yet. A change in the image might just trigger them to click.”
Here, you'll see how image testing works in smartocto.