Smartocto believes that editors need to have one overall metric that tells them how their audience feels about their content. That metric is called CPI: Content Performance Indicator. Here’s what it is in 5 questions and answers.

A decade ago, data analytics for stories was barely discussed among editors. Later, we encountered simplistic metrics like page views and likes. Subsequently, we were overwhelmed with vast amounts of data, making it challenging for regular individuals to extract meaningful insights. Today, we strike a balance between user-friendliness and data depth, finding the perfect equilibrium.

Over the years, smartocto has dedicated extensive effort to develop a tool capable of extracting the most valuable and actionable insights from the sea of data. Our aim is to present this information in an easily understandable manner, seamlessly integrating it into the workflows of editors, bloggers, PR consultants, and marketers.

Not familiar with our tool yet? We can do a free guided tour via the button below.

What is a Content Performance Indicator?

Imagine yourself as an observer in the historical insights section of smartocto's engine room. We feed our clients' data into the machine, and an algorithm generates an outcome on a scale from 0 to 1000. This scale indicates how visitors engage with the content.

At the center of this scale is the median value, which is 500. You can say that this outcome is normal on a website. It's slightly different than 'average', because then outliers would have too much influence.

Milena Tihojević, client relation manager at smartocto, emphasises that metrics used for CPI are not based on any industry standards, and that CPI it is not intended for comparing your performance with your competitors. Instead, it is solely based on your own content and your own traffic. These numbers reflect your specific achievements thus far. So, you are basically always competing with yourself.

The CPI score of an article is a compound metric, incorporating various other measurements such as page views, attention time, read depth, and social actions, among others. While there is one overall CPI score, there are also three additional CPIs that shed light on specific readers’ behaviour:

  • CPI Exposure: Indicates the reach of your content, including metrics like page views and social actions.
  • CPI Engagement: Provides insights into visitor actions when consuming the content on the website, such as attentive reading: spending enough time, reading thoroughly, clicking through, etc.
  • CPI Loyalty: Offers information about the behavior of habitually highly engaged readers, who are generally the most valuable audience for media.

CPI Exposure is mostly related to the Advertising model, CPI Engagement to native advertising, and CPI Loyalty to the Subscriptions business model.

___________________

To make it a little more complex for the data nerds who are reading this: to compare the CPI with the base, we have two perspectives: article and traffic (check link for more). From the article perspective, the algorithm takes everything published in the last 30 days and compares them with each other. The CPI is pre-calculated and this calculation is done once a day, very early in the morning when all the traffic from the previous day is processed. The CPI of the articles doesn’t change until the next day. In the traffic perspective, the CPI algorithm is applied to whatever is currently in your focus. It has a 'flat' view on dimensions where sections, topics, and authors are at the same level as articles - they are all eligible for comparison.
___________________

What does the CPI look like?

You can view the CPI for:

  • Articles
  • Topics
  • Sections
  • Authors
  • Website

Below, you'll find several ways in which the CPI is presented in Insights.

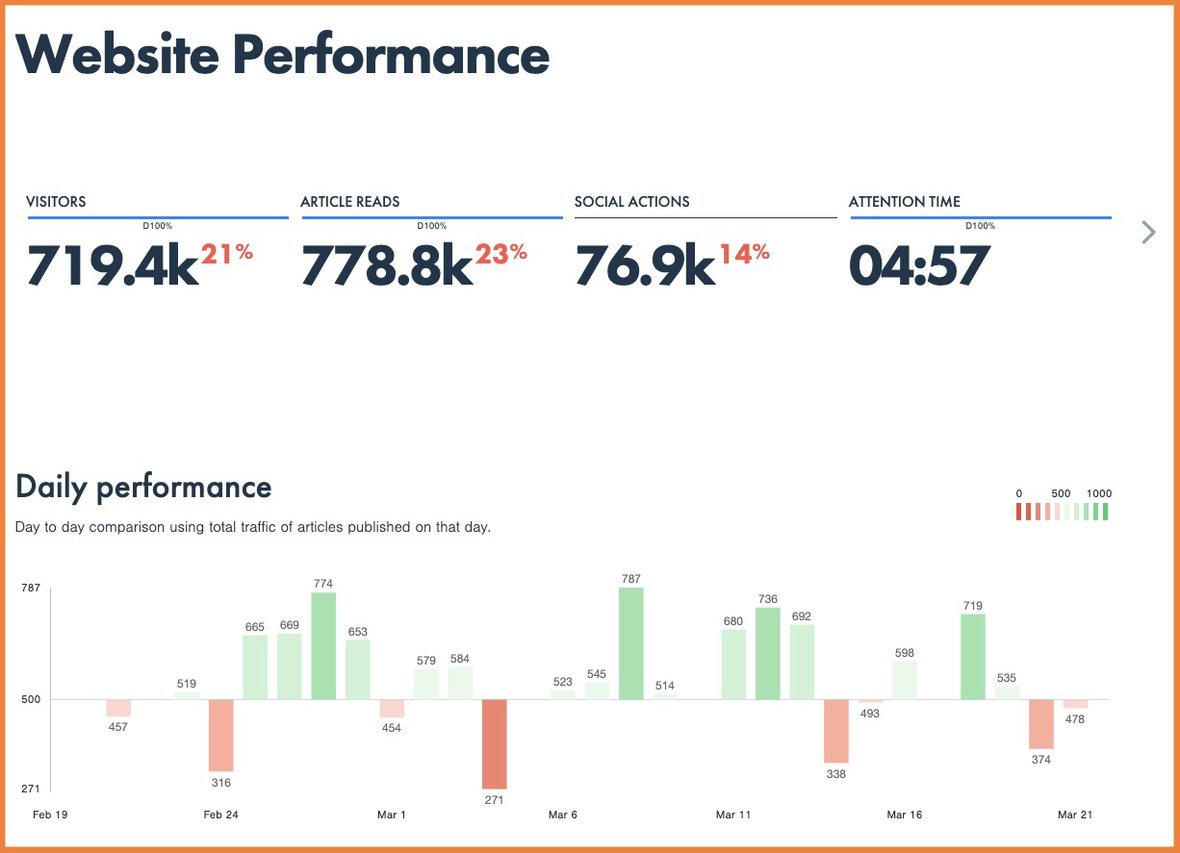
CPI website performance insights
Here, you can easily observe which days performed well and which ones did not.
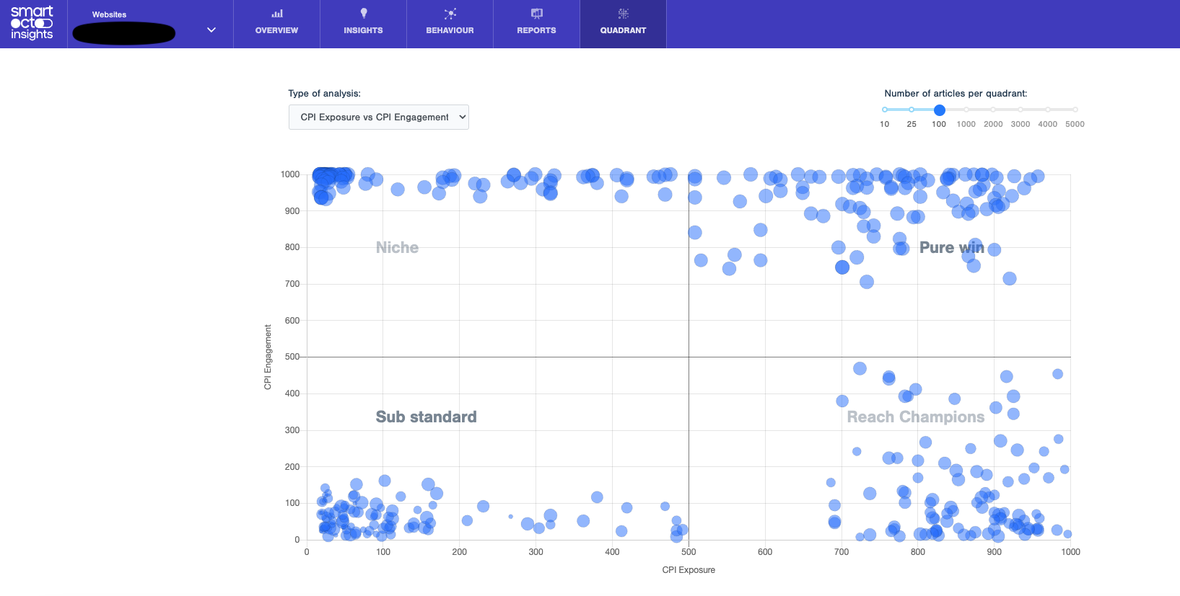
performance quadrant model
In the Topics Quadrant Model of content optimisation, you can create two axes, for example, Exposure and Engagement. The articles, topics, or sections that score well on both elements will appear in the top-right quadrant.

Smartocto can also show how individual authors are performing. On some editorial teams, this is a controversial element, as it may lead to a culture of competitiveness. In Germany, it's even legally prohibited.

The technical staff can always disable this feature. It’s an offer because it can serve as a starting point to better support editors in their work. However, it's crucial that everyone in the organisation understands what CPI means. On the article level, it is not always black and white when it comes to author’s performance. For instance, there could be a significant difference between one author creating five articles per day with a high reach and another author achieving more subscriptions with a single powerful article. To explain such variations, you always need to delve deeper into the data.

Why does smartocto think CPI is the best metric?

Media outlets have come to realise that focusing solely on one metric doesn't yield much insight. Journalists are frustrated when they are told that their piece had only a few page views. It gives the impression that their work wasn't good enough, although such judgment cannot be made solely based on reach.

Moreover, storytellers are primarily passionate about their stories; they are not necessarily fond of complex numbers and data. There's also the risk of forming judgments about articles based on personal opinions. In contrast, the CPI provides an objective assessment based on the performance of your own website content.

Having a clear understanding of how articles perform is crucial. The online competition is fierce, advertisers demand concrete figures, and journalism needs to generate revenue. Furthermore, there's a natural desire to know if your message has resonated with the audience.

The Content Performance Indicator satisfies the hunger for valuable information. "With a single figure, you get the full picture. It simplifies your life," says Milena. "Consider the common metrics as puzzle pieces. The CPI puts the puzzle together for you, so you instantly have a clear and comprehensive view. To provide a more targeted understanding of the key content aspects, we offer not only an overall score but also individual scores for exposure, engagement, and loyalty."

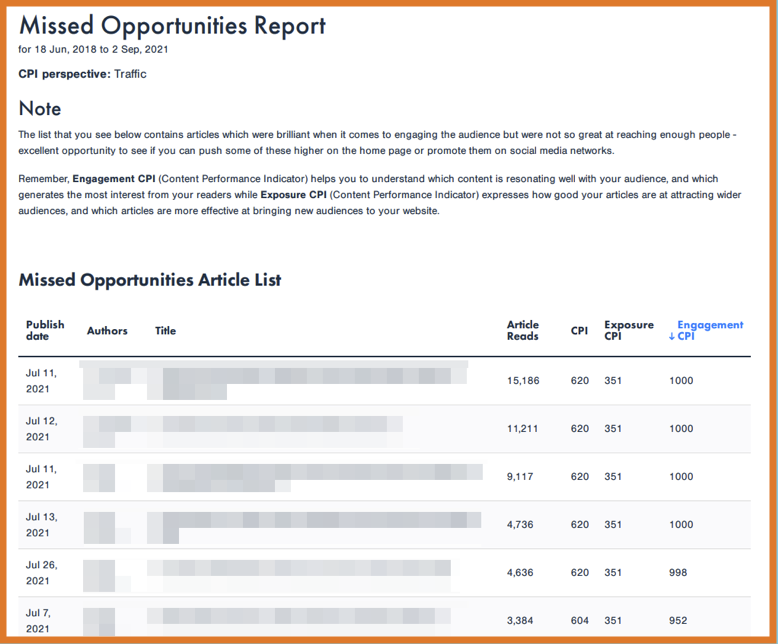
Missed opportunities
You can create customisable reports with CPI as the most important metric, like this one about your missed opportunities.

When should you look at the CPI?

The timing for reviewing the CPI depends on your role within the company. Some editors prefer to check the top 5 articles daily to see what resonates with the audience. This information can be used to work on follow-up content for the next day, for example.

Data analysts, editors-in-chief, or top management might focus on longer-term trends. They can review data from the past year or compare year-on-year performance. Is the performance improving or declining? Can we find reasons in the data for any changes? For answering such questions, the CPI provides valuable insights.

In smartocto Real Time, the CPI is not displayed as the number can fluctuate rapidly. "We visualise this information solely in our historical data feature called Insights that is often used for strategic analysis," says Milena. "In the real-time features, the focus lies elsewhere. There, you mainly want to see how many visitors are coming from where and what you can do to distribute the content better, like placing it in a newsletter. Stuff you can do immediatelly to improve the results."

How does the algorithm work, and why should you trust the outcome?

Similar to how TikTok doesn't reveal the actions that determine which video comes next or how Spotify doesn't disclose how personalised playlists are formed, smartocto cannot divulge the exact process behind the outcome (CPI). It remains a trade secret. It took time and the final version came from many tests on a large amount of articles from multiple clients and by learning from the success or fails of those tests.

However, this doesn't mean we don't provide any insight into its components. "Think of it like a dish served in a restaurant," says Milena. "We can tell you the ingredients, but we won't reveal the exact proportions or preparation. Customers rarely inquire about this. If they do, it's usually data analysts accustomed to working with algorithms."

To convince clients, Milena mentions that smartocto was founded by people with a background in the media industry. “Therefore, we understand the challenges faced by editorial teams and what matters to them.”

However, even the CPI isn't always a perfect solution, adds Milena. "You also need your journalistic instinct to determine if a topic is important or could become significant. The CPI and any other scores from the system mainly help you understand your audience better and see the forest - not just the trees."