What drives journalism? Is it revenue, or a responsibility to society? Some would say both, but the reality is that most lean towards the revenue side, with the media and news sector being predominantly commercially driven. There is however a group of media (often public) that create their content strategy around a certain task, mission, vision or message that they want to fulfil. The value, or success, of the stories they publish is not easily expressed in simple metrics. For them, it's about social impact. These companies will find that most of the editorial analytics systems out there were not designed with their challenges in mind.
Public media need a special metric and content strategy
April 22, 2021 by Erik van Heeswijk

Most analytics systems are commercially oriented
How do you calculate social impact?
Data driven approaches are tailored towards commercial metrics and systems, with pageviews and conversions as the main KPI’s. Systems like recommendation engines or dashboards mostly make sense in a subscription or advertising setting. They're not designed to calculate social impact, or whether stories contribute to the publisher's mission or support democracy.
Although the workflows of public journalism and their content are pretty similar to their commercial ones, the overarching goal is different. Public media is centred around awareness, informing citizens and promoting culture. Working with data should reflect that reality. In other words; their data analytics system should emphasise the metrics that matter to public broadcasters, and these are not single metrics. It calls for more advanced data, and a strategy for your most important stories to make sure they support the mission as much as possible. This is what we thought about when we started creating our own public metric.
What analytics based on public metrics could look like
Let's first think of how to determine media impact at all. We think it should be divided into three main categories of behaviour.
- Reach/exposure
The number of (new) people that see the content. This includes a metric mix of pageviews, a profile of that audience, and their first interaction with the brand. - Consumption/engagement
The way people are interacting with the content, the number of seconds they watch, the number of words they read, reactions such as comments or likes. - Loyalty/format & overall brand stickiness
The effect that the content has on the relationship between the audience and the brand. What attracts them to the mission and format, how it leads to conversion.
Two things are relevant here:
First of all, reach is very important for public media. However, we are convinced that it would be a logical approach for public media to give engagement and loyalty more weight.
In a commercial setting reach is something that can be monetised instantly; in a mission driven setting its value is dependent on its relation to engagement and loyalty.
public value needs a compound metric
Secondly: there are multiple possible approaches to measuring this behaviour. Making a KPI system, with simple single metrics, that works for public media, is easy enough. But public value is more layered than that - it needs more of a compound metric.
Engagement or loyalty should be measured by multiple metrics that give a real sense of audience behaviour. Our Story Value Engine enables this with CPI, or Content Performance Indicator. This is a so-called compound metric that is based on those three main categories of behaviour, reach, engagement and loyalty.
The CPI of a story takes all these things into account, and calculates a score that's much more representative of the true ‘success’ of a story than the snapshots a single metric provides. Based on this score, and the components it's built out of, you can easily determine if a story has hit the mark - or missed it entirely.
Story relavance and mission value
But, even if you approach user behaviour and conversion in this broader sense, something is still missing: story relevance. Some topics are more relevant to society than others. Or to be a bit more exact: some topics are more central to the mission that, for example, public broadcasters are wedded to. To give an extreme example: climate change, politics and cultural issues are closer to their heart than the latest Beyonce album - however bombastic that might be.
That's why we like to include a Mission value index as well: how do specific subjects correlate to the audiences that we are trying to impact, and the publisher's mission? The mission value of a story should influence how you treat its publication, as is visualised in the image below.
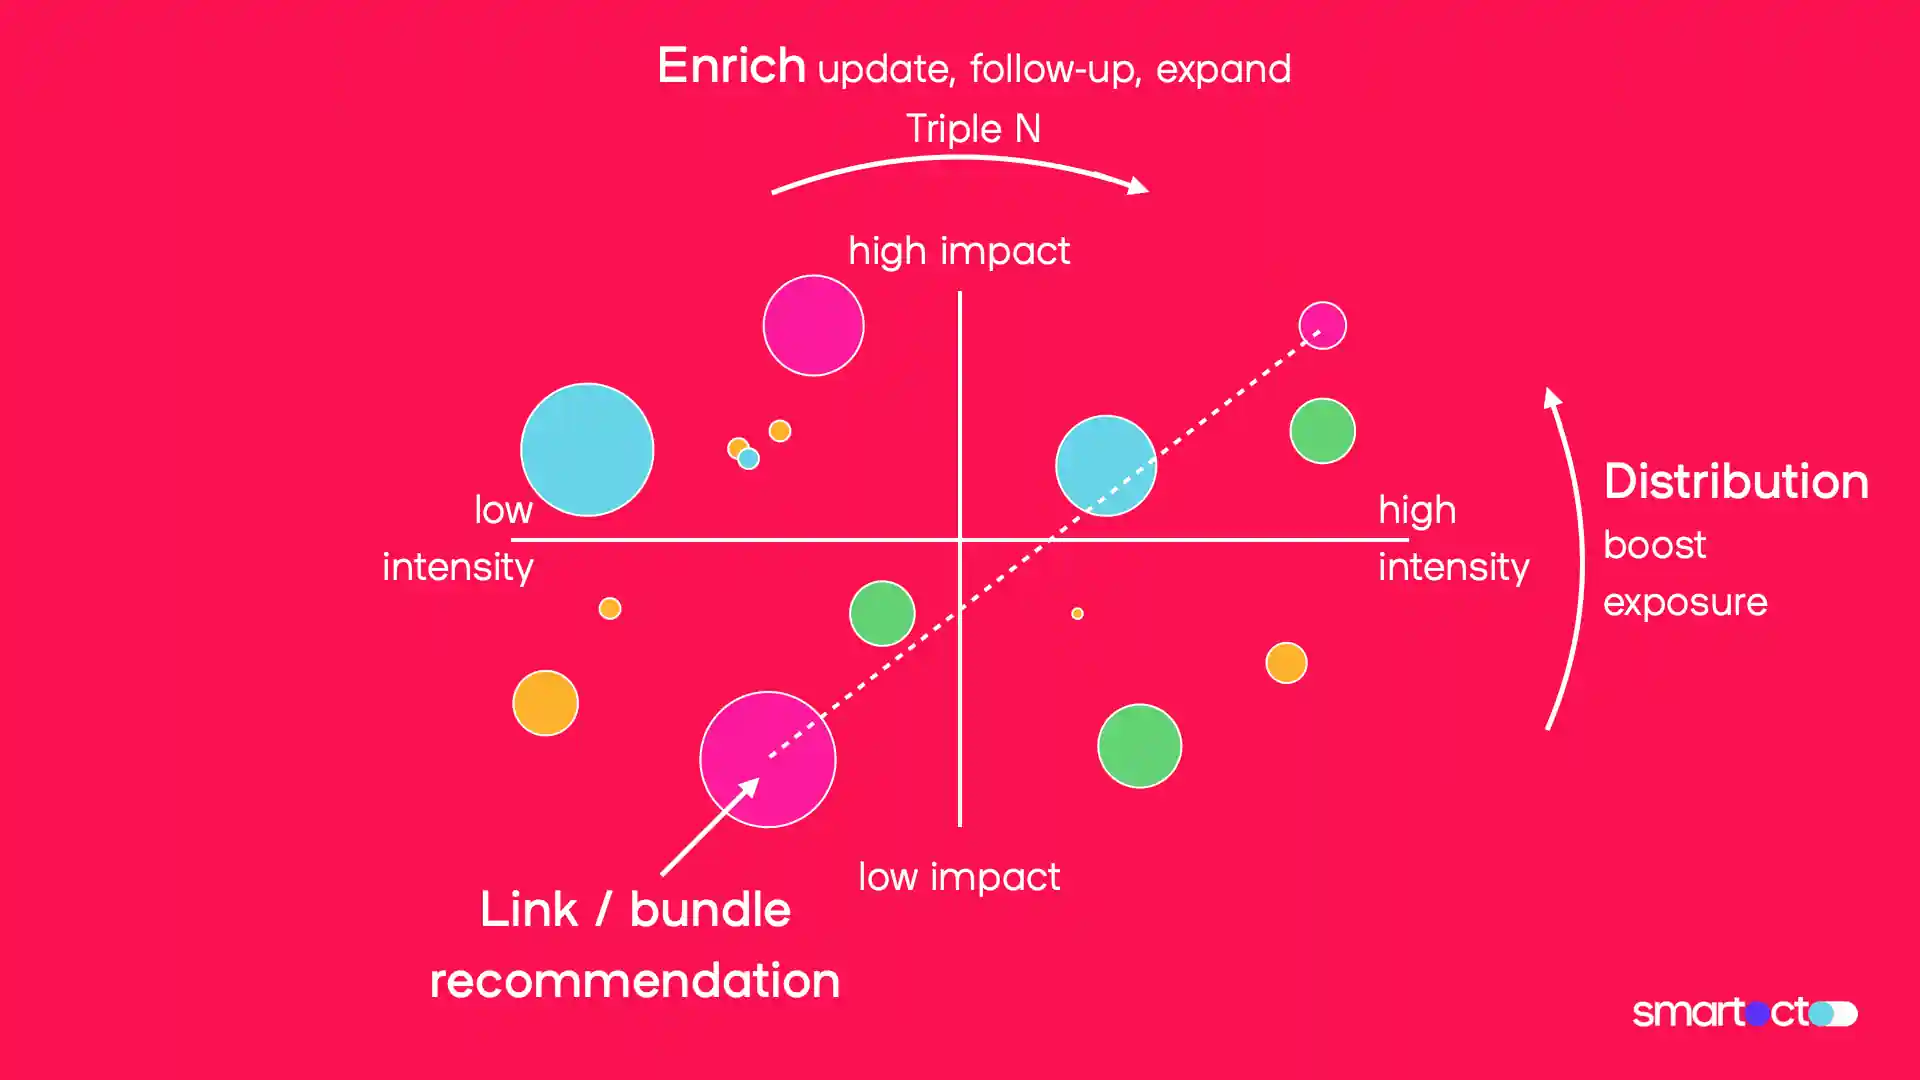
The X-axis shows intensity (a combination of attractiveness and relevance) and the Y-axis shows reach (how much impact the story generated). Any story can be put somewhere in this diagram, but its place depends on the mission of the publishers and the demands of the audience. Once you know where the story sits in the diagram, it gives you a clear picture of what you can do in terms of optimisation.
- Stories with low intensity can be boosted with updates, or follow-ups from different user needs perspectives.
- Stories with low impact can be supported by better distribution on multiple channels or increased exposure by linking it to other stories.
Once you know what stories are important to your mission and close to your audience's interests, it becomes easier to identify your 'signature stories'. By tracking the performance of these through complex metrics, and boosting their performance by plotting them on the quadrant, public media can get one step closer to determining how articles support their strategy.
Developments in the smartocto Story Value Lab
The number of public organisations working with smartocto is growing, and by creating a metric catered to their needs we should be able to help them succeed in their mission. Our metrics give you insights, and we're currently working to automatically recognise where stories sit in the mission value quadrant. Custom notifications deliver tips that help boost performance and open your eyes to possibilities that maybe you haven't thought of before, or serve as a simple reminder.
To learn more about this project, you can read our news update. More information on our Value Lab, where we work on lots of different projects to create more value for all our users, can be found on the Story Value Lab page.
Like our content?
Subscribe to our newsletter to receive blogs, news and updates.
you may also like...
How we built news needs notifications

Data study: the true value of loyal readers