You probably know how many people read your stories, but do you know how many really read them? Or how much time they spend on your average article? We’ve crunched the numbers across more than 300,000 articles to give you solid, 2025-proof benchmarks for page depth, read depth and attention time.
Metrics that matter: editorial analytics benchmarks
July 17, 2025 by Em Kuntze
When it comes to metrics and editorial analytics, understanding them is usually fairly straightforward: the bigger the number the better. Large numbers of reads, likes, shares and follows are A Good Thing. It’s possible to intuit success fairly easily. But with simplicity comes a risk of over-simplification - and we’re often asked what constitutes a ‘good’ result with other metrics.
In the smartocto Insights part of the tool (the bit that deals with historical data and past performance), there are three metrics in particular which have specific value for publishers looking to nurture engagement. Unlike simple metrics, though, it might not be immediately obvious if the result you’re looking at is a good one.
Numbers are not only digits; they contain a story and even more important: a direction.

Erik van Heeswijk ceo smartocto
We asked our data scientists to perform an analysis to see if we could get an across-the-board median benchmark. Hopefully you’ll find this information useful when looking at your own results
A quick note on our methodology
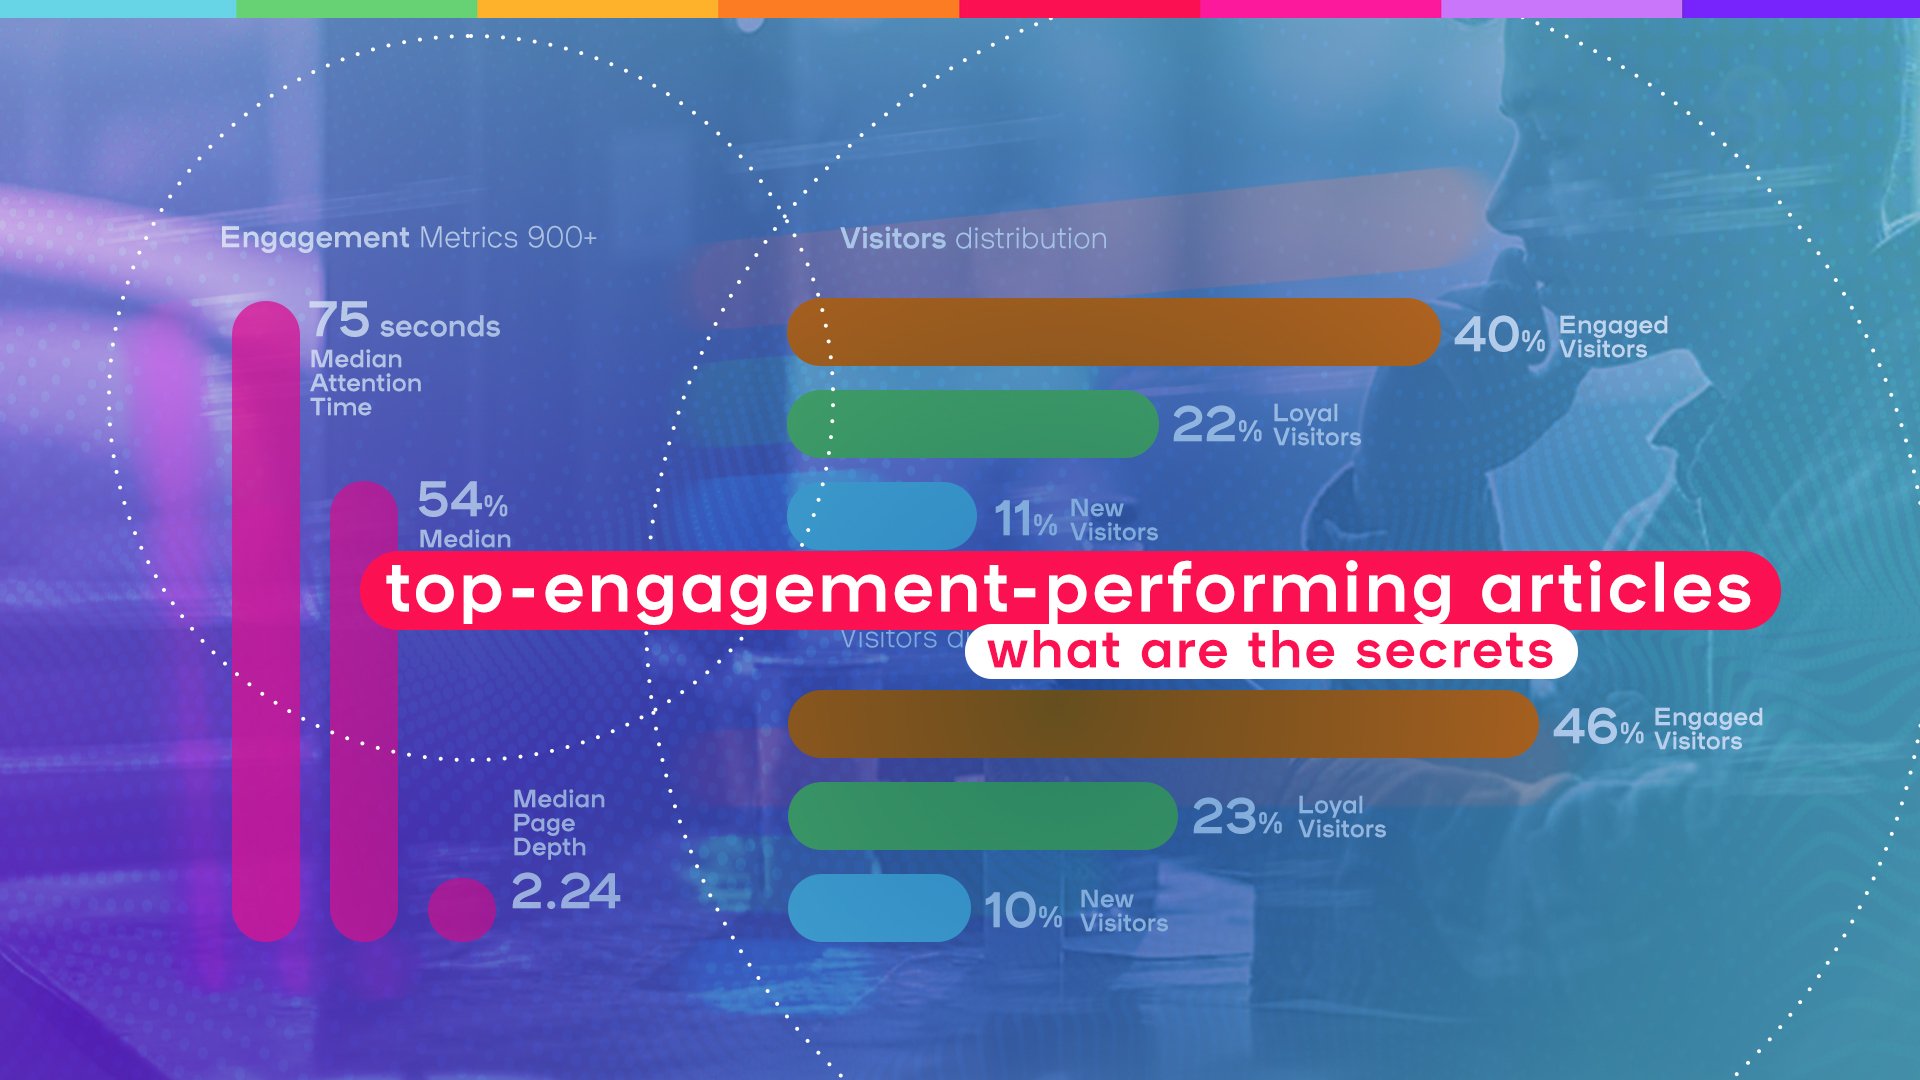
Our data team looked at 343,167 articles from 231 brands published between March and May 2025. The total article reads here were 3349 million. From this we calculated median results.
Page depth
what it is
Page Depth calculates the average number of articles that are visited during readers' reading sessions.
The result is recorded as pages.
(In other words: how many articles are opened once the reader comes to your website and clicks on that first story)
what it isn't
Read Depth (see below)
why you need it
Readers who stick around are what most newsrooms want. Engaged and loyal readers make for better long-term, paying prospects and so if you can understand the behaviour that results in people staying on your website, it makes it easier to drill down and understand how to replicate that behaviour:
- Are they particular types of articles that lead to longer session times?
- Can you ascribe particular user needs or formats to these?
- Are readers given ample opportunity to explore related articles and stories from different angles?
Our 2025 benchmark for PAGE DEPTH is 1.92

Bojana Soro senior data analyst
PAGE DEPTH: Rutger's top tip
Thinking about the reading experience as a whole is something all newsrooms should put high on their list of priorities when they’re planning their content. What information would be useful or tempting for readers of that first article? Are there obvious chains of information you could create? When we run consultancy sessions, we encourage clients to think about addressing topics or news subjects from multiple user needs perspectives for exactly this reason.
It’s my personal pet-topic to put emphasis on understanding the key values of your brand and making sure that your news coverage falls in line with them. It’s easy to say that your news brand stands for relevance and independent news coverage but does that really count for all your content? How can you make your news stand out - and what’s your USP compared to your competitors? It’s not easy - since it's news and not candy bars - but it’s worth considering and doubling down on because it’s THE reason why your audience will keep coming back to your platform to consume the news.
Read depth
what it is
A compound metric that reveals how deeply a reader has got into reading a piece of content.
As it is not a simple metric, several things are taken into account when performing the calculation:
- True attention time
- Length of the text
- Scroll-depth
- Average time taken to read the content
what it isn't
*page depth (see above)
*scroll depth (this is simply how far a reader got through an article, expressed as a percentage)
*weed depth (this isn't something we can help you with. We recommend consulting a gardener for this issue)
why you need it
Read depth is a very useful snapshot of the health of an article. If the average is less than half, it’s a clear indication that you should rethink key aspects of that piece: is it just too long? Could there be a better format? Are links or ad placements getting in the way of the reader experience?
Our 2025 benchmark for READ DEPTH is 44.06%
Bojana Soro senior data analyst
Yes, that’s correct.
Your average reader reads less than half of the average article.
This can be a hard result to accept. It’s an easy result to skim over and pretend isn’t true. But it’s a really, really important thing to look at.
READ DEPTH: Rutger's top tip
No one wants to admit that half their words go unread, but that’s the reality for a lot of newsrooms, a lot of the time. The obvious solution is to just write shorter articles. Get to the point fast, and hook readers that way. More than that, though, consider format and timing as well. If you’re scheduling articles to be published during a morning commute, perhaps a summary might yield attention for longer than a deep dive would.
And from a user needs perspective, make sure your stories are written from a specific angle, keep it short and to the point - and consider a follow up from an alternative user needs angle to keep your audience interested in the topic. This way you'll ensure you're covering it thoroughly, and from multiple perspectives.
Attention time
what it is
The time a user actually spends on a page reading the content. We look only at ‘engaged time’
- In smartocto Insights, Average attention time is expressed in minutes and seconds; Total Attention time is recorded in hours
- Both article and landing page are aggregated if no page type filter is applied
what it isn't
Time that includes ‘idle time’ - i.e. the seven minutes in which you made a cup of coffee, signed for a delivery, or went to help Brian reboot his laptop
why you need it
It’s a tangible measure of the kind of time you have to relay key information to your readers.
Our 2025 benchmark for ATTENTION TIME is 45.04 seconds
Bojana Soro senior data analyst
ATTENTION TIME: Rutger's top tip
Make sure your headline is in sync with the actual article. Address something in the headline that you will reveal/ answer/ deep dive in the article. And stay on topic. That way you have the highest chance of getting higher attention time. But don’t rely on this metric alone. Shorter articles will (obviously) have shorter attention spans. So it’s not always bad if that specific number is low … it should (also) be compared to the scroll depth.