Begin 2019 we weren't aware that COVID-19 would ever exist, but it took only a matter of weeks for the novel coronavirus to make its way from Asia and spread across the world, changing every segment of our lives along the way. 

So let us take you back to the beginning. In a short period of time, the coronavirus starts shaking the very foundations of modern society and claims tens of thousands of lives. Europe has become its epicenter. And, situated in the heart of Europe – where the curfews and tight measures are particularly strict – the disconcerting sight of empty streets means we feel the effects particularly keenly.

Restrictions are placed on people by lockdowns and the only places buzzing with more people than usual are online news outlets.

The pandemic has created a hunger for information that we rarely see, and we are all aware of that

At smartocto we were interested to find out how strong that hunger is. To research this, we’ve been looking mostly at European publishers. The data we acquired relates to February and March 2020 – the time Europe became the world’s coronavirus hotspot. 

In the following chapters, we reveal how big the growth in traffic for publishers in European countries was, with the focus on the ones most affected by the coronavirus. This way we will see the direct impact the coronavirus pandemic has had on online news audiences.  More importantly, we will be able to analyse how the crisis affects reader loyalty, which many operating on reader revenue models consider their north star metric. 

(Here’s a little hint, there were never as many loyal readers as now) 

And, yes the size of the crisis in your country has a huge impact on peoples’ need for news.

The traffic spike is real 

We analysed the data for 15 online European news outlets that use smartocto reports to data-inform their newsrooms. We picked the ones located in the countries most affected by the coronavirus pandemic – Italy, Spain, Germany, France, Switzerland, Austria, etc.

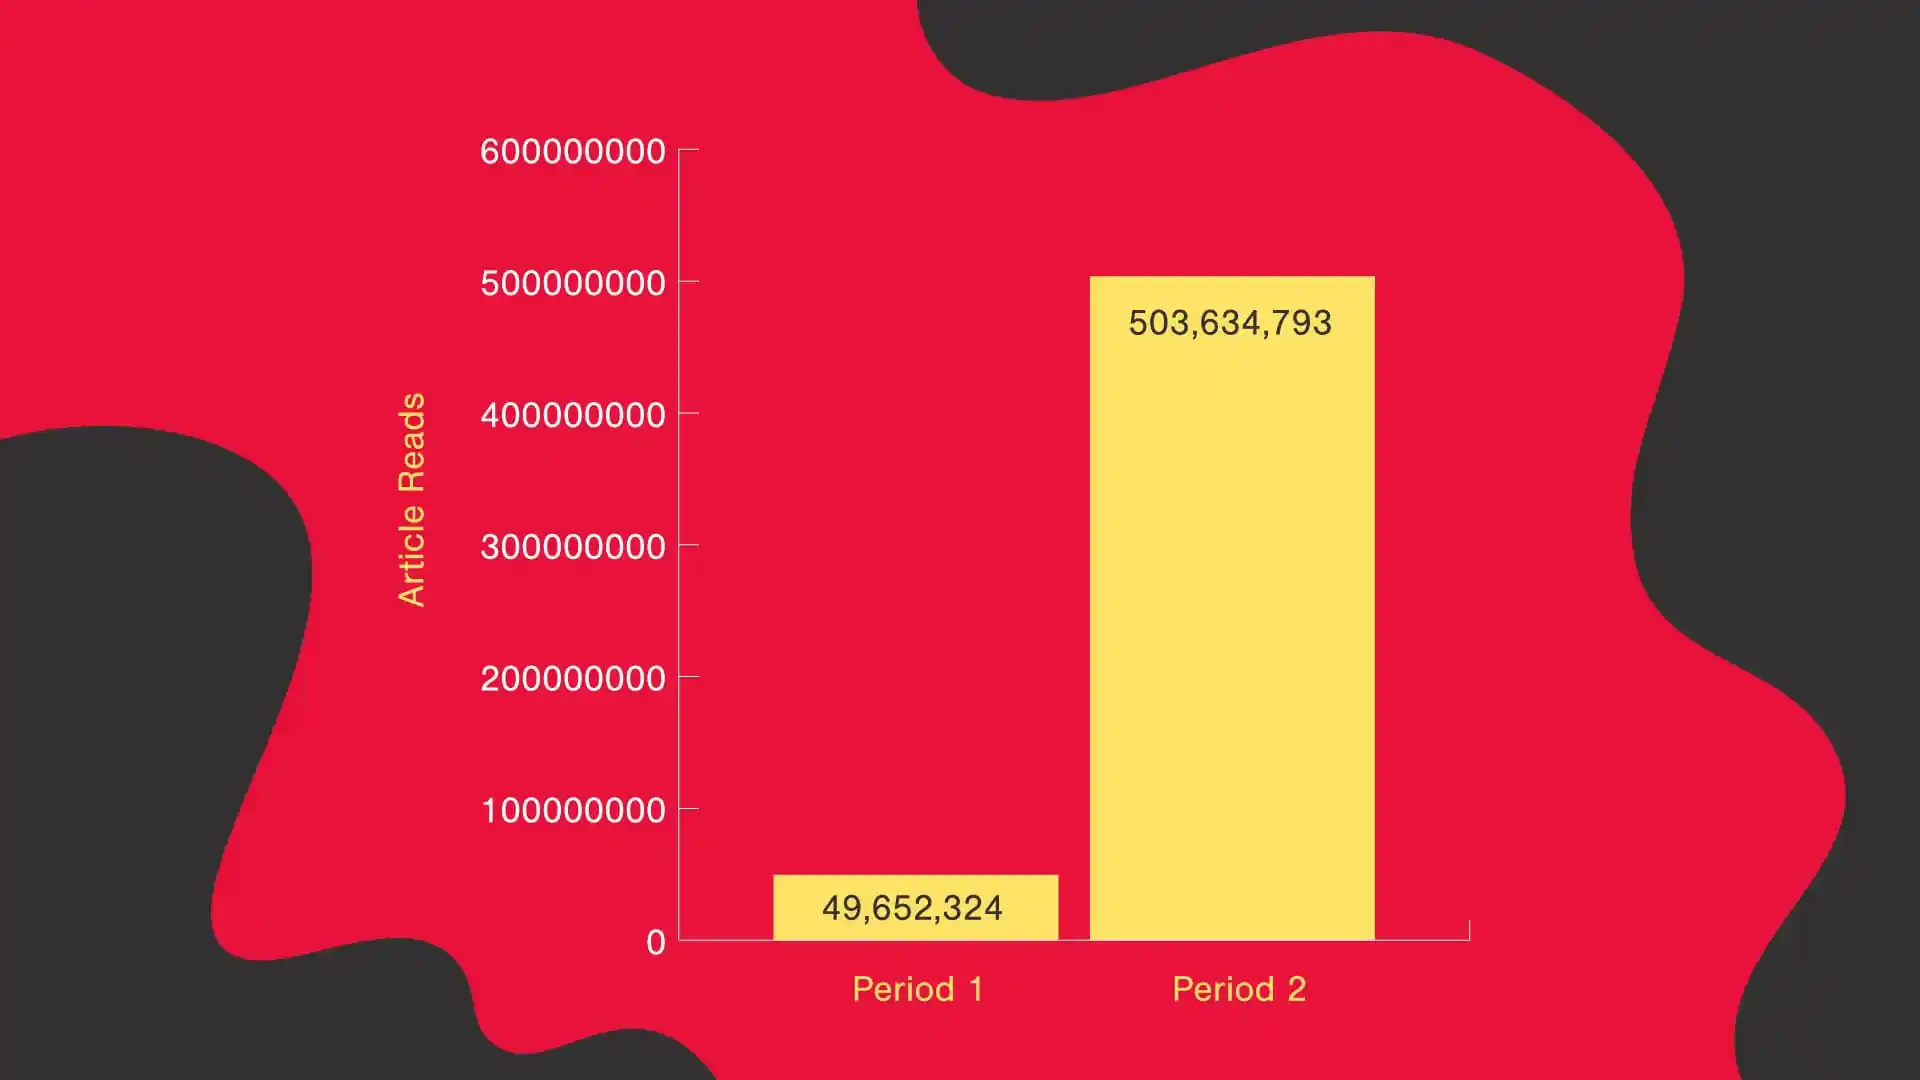
What we learned is staggering. We compared two periods: the first one starting January 22nd and ending February 22nd 2020, and the second one starting February 23rd and ending March 23rd 2020 in order to include the freshest set of data we possibly can. 

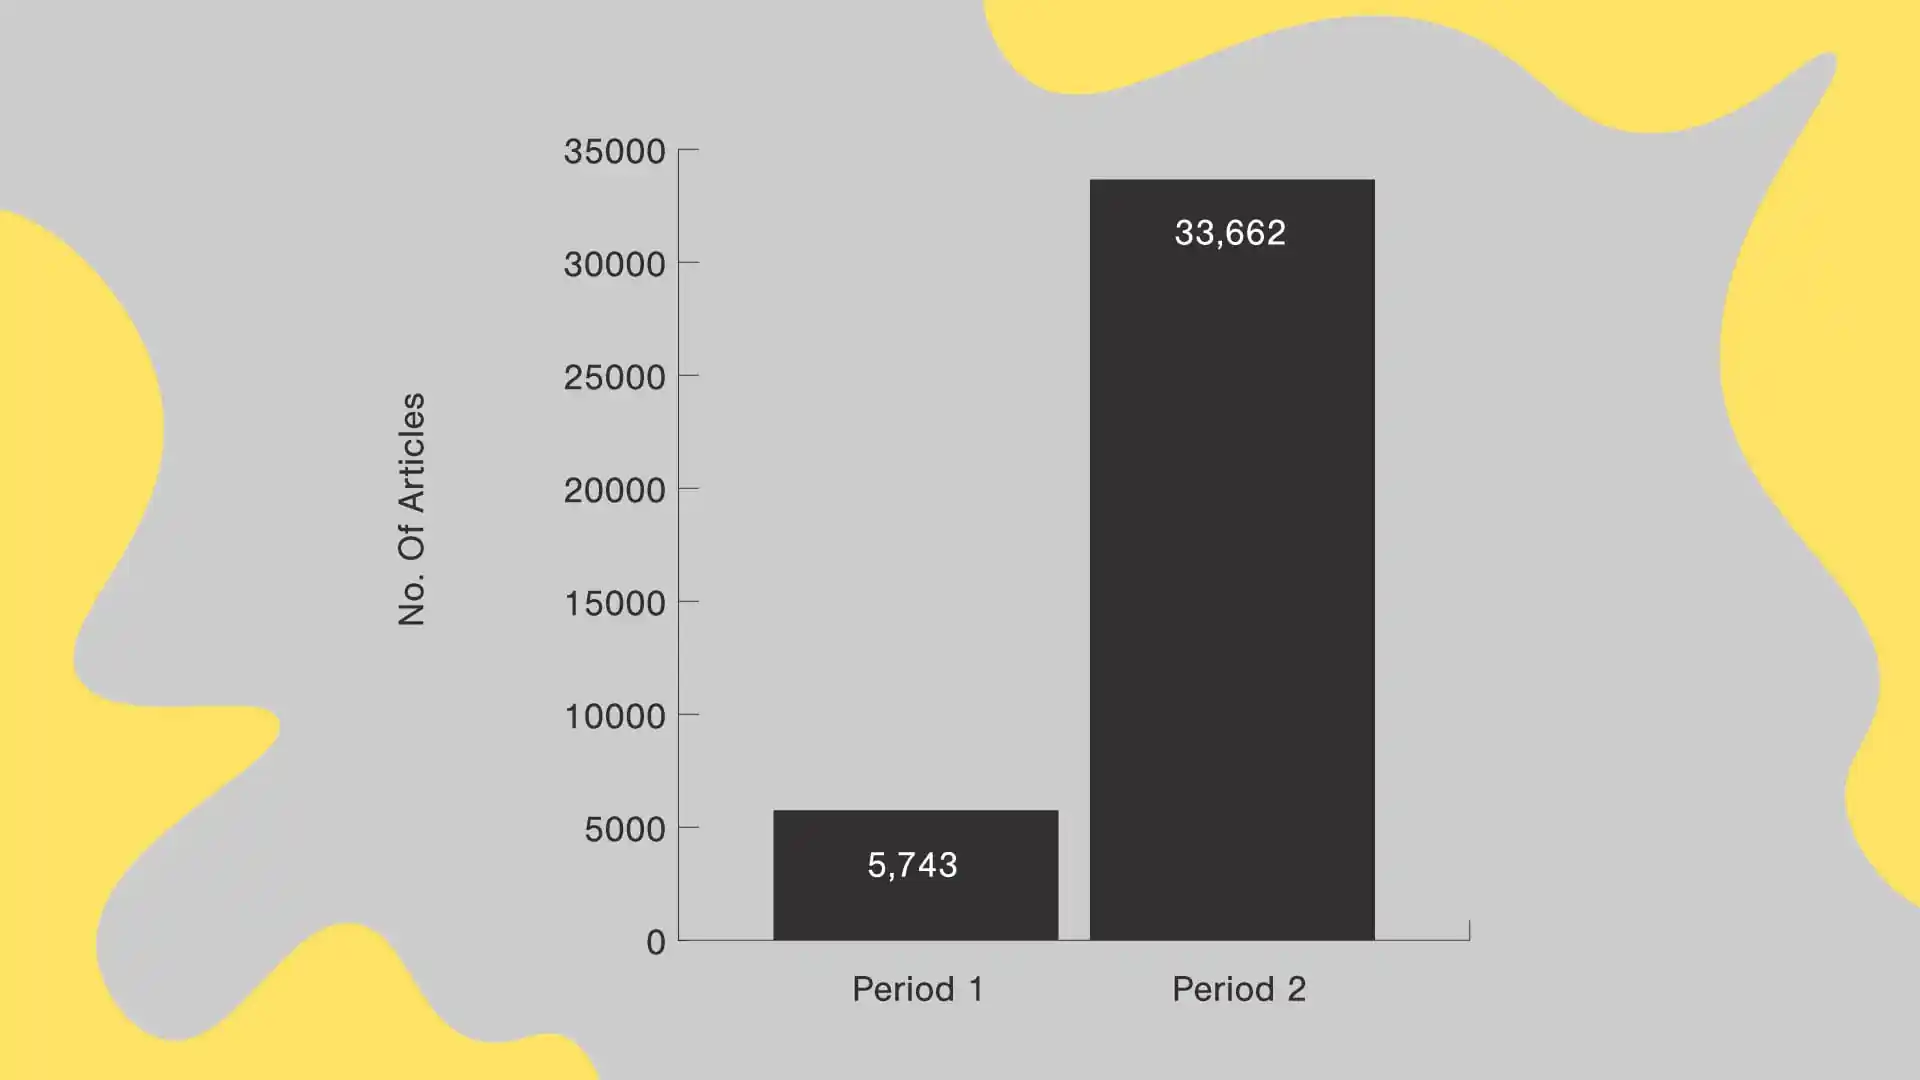
In the second period, media outlets have recorded an increase of 55% of Article Reads per post on average. In total, on the website level, online media grew the number of Article Reads by 23%. All of this was achieved by actually reducing the number of published articles by 4%.

A comparison of article reads between January/February and February/March

The Article Read metric is not the same as a Page-view as it tells you how many times someone actually started reading your content. In order for us to calculate the Article Read a real person has to spend at least 10 seconds reading it. 

It’s clear that the size of the crisis affects peoples’ interest in the news. For example, media located in Italy, Spain, France, and Austria achieved the biggest growth in the number of reads. Outlets from those four countries recorded a growth between 188% of Article Reads to as high as 622% of Article Reads. 

And Loyalty? Well, that’s seen a massive upswing too

Although lots of news outlets use single metrics (such as Pageviews, or even Time Spent on Page) as a straightforward way to define the impact of their online storytelling, they aren’t able to reveal much nuance about the relationship you have with your audience. It's worth looking at things like reader loyalty and article value, which are more sophisticated ways of measuring if your strategy is working in the long run.

At smartocto, we define loyal readers as those who are habitually highly engaged readers. Basically, those are people who are most likely to pay for your content, since they are the most ‘hardcore fans’ of your news outlet. That’s why we are looking at how their number changed during this crisis. 

in a single month, some media grew their loyal readership between 10 and 15 times

The number of loyal readers grew by 29% for all media outlets combined when comparing the first and second period. Media from Italy, Spain, and Switzerland got the highest growth in the number of loyal readers ranging from 1174% to 1498%. So, in a single month, some media grew their loyal readership between 10 and 15 times, which is another indicator of just how hungry people are for fresh and accurate information. 

This affects the subscription game. Digiday reported that publishers in Europe saw subscription rates rise by 268% compared to the same week last year. 

Coronavirus stories became ten times more popular

We wanted to take this analysis one step further and discover how corona reporting has changed in a period of one month. So, we dug deep into the topics covered by 15 media outlets and aggregated data for more than 300 topics concerning the virus. 

Our data shows just over 5,700 articles were reported about coronavirus from January 22nd to February 22nd, but that number grew by more than six times when we look at the period from 23rd February to 22nd March. In the second period, there were well over 33,600 articles covering COVID-19 related topics. 

Comparison of number of articles in January/February vs. February/March

In terms of the number of reads, in the first period, these topics recorded almost 50 million Article Reads, while in the second period that number is 10 times higher with over 500 million Article Reads. Undoubtedly, this shows people were looking for information on coronavirus on a whole new level. But one thing that might have significantly influenced the amount of traffic to these stories was the fact that many – if not most – publishers are dropping their paywalls on coronavirus articles. 

We recorded a significant difference in the social media buzz when it comes to these articles in these two periods. The number of Social Actions in the first period was around 3.7 million. It seems that everyone on social media started talking about the pandemic as it spread, and the number of Social Actions in the second period went up by almost 10 times. We recorded 34.2 million Social Actions.

Social actions in January/February vs. February/March

Surprisingly, engagement metrics for stories about coronavirus remained almost the same through these two months.

In the first period we recorded an average Attention Time on a story about coronavirus of 52 seconds, a Read Depth of 40.9% on average, and a Page Depth of 1.69 pages on average during a single reading session.  Those metrics didn’t change a lot in the second timeframe we looked at: Attention time decreased to 51 seconds, Read Depth decreased at 40.8%, but Page Depth grew to 1.73 pages.

This shows us that people read the stories about the virus with the same passion in the first days of the outbreak as they did as it evolved. The thing that’s changing is the number of readers and not their relationship with the story. 

For now, publishers are well-tasked with keeping the public informed. Whether or not these readers will continue to look to these various publications with the same fervor once the crisis has ebbed is another matter – and that’s something probably best left for future discussions.

Stay safe, everyone.


Oh and while you're here. You might want to subscribe to our newsletter!