According to the recent Gartner Top 10 Trends in Data & Analytics report “the ability to seamlessly go from data to insight to model to action has been the holy grail of data and analytics.” Organisations that are able to fix this can reap the benefits of closed loop impact adjustment and improved productivity. When talking about the impact on organisations and skills, Gartner foresees an increased collaboration and interaction between data and analytics roles, which naturally has consequences for processes and people. Among other things, it promises to ‘unlock’ data for more non-tech users and causes less friction between workflows and roles.

In that same report, Gartner introduced some recommendations for data and analytics leaders. One of them is to “expand analytical capabilities, roles and processes by focusing on the business priorities and issues to be addressed. Think ‘end-to-end’ in relation to the analytics life cycle and top-to-bottom’ in relation to the data and analytics stack.” They also propose to “anticipate changes [ ] in how analytics becomes an active participant in data management [ ]. Tools will require a collaborative workflow of an ask-and-answer nature between data dictionary and data acquisition.”

What do ‘optimise’ and ‘value’ mean for your organisation?

This also goes for newsrooms and media publishers. When creating continuous flows of content, these organisations also produce virtually unlimited amounts of data. And when you run the show, you want this data to work for you. You want to put it to good use, optimising the content flow, improving story impact and in the end creating value for your business.

you want this data to work for you

The big question you have to ask yourself is: what do ‘optimise’ and ‘value’ mean for your organisation? It depends on your business model, on the way you organise your newsroom, on the roles the people in the newsroom have and on the goals you have created for yourself.

From data to action

This is exactly what drove us to create smartocto. There are numerous tools out there with fancy dashboards that show a lot of data and graphs. But we felt we needed more. What you want (and certainly what we would have wanted) is actionability, not just stacks of data. When publishing a story you want direct feedback - and answers to the questions we know newsrooms need answering: How does it perform? What can you do to create more reach or impact? Which channel is most relevant or convenient for your readers? Will tweaking the headline attract more loyal readers?

we need more than fancy dashboards with lots of data and graphs

Smartocto is an analytics tool that translates data directly into actionable and smart notifications. And ‘smart’ goes a long way. It means that before implementing smartocto into your workflow, we have a good talk about what you want to get out of it. If you aim for huge numbers of eyeballs to satisfy your advertisers, you want your notifications attuned to this perspective. And, if you want your editors to get different info from your data analysts, that’s a consideration we take into account when we set it up for you. Even your channel strategy should be mirrored in the kind of alerts you receive.

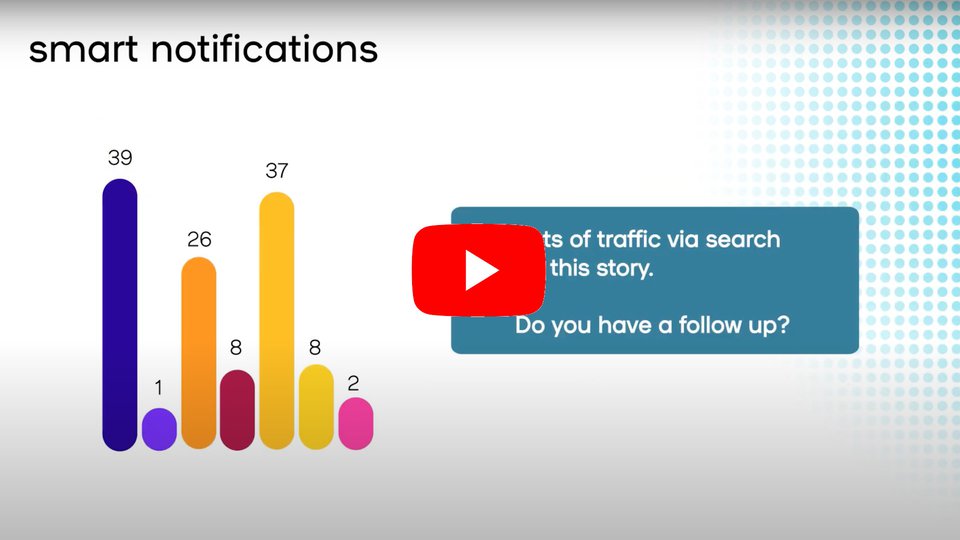
Smart also means actionable in our lingo. When you receive an alert that says ‘your story has reached an audience of 1,000 readers’ that’s nice, but really you’re none the wiser. It isn’t very actionable. Our notifications are full of tips and advice. An example? How about this for starters: when the subject of a story you just published also gets talked about a lot on Facebook, smartocto gives you a heads up. “Might be wise to publish your story there, too!” Or “This story attracted a lot of readers! Can you create a follow up?” If notifications aren’t actionable, then really, what’s the point? That’s why ours are.

smartocto's notifications in action

tip box

When notifications start telling editors ‘what to do’, they could be regarded as a threat. To prevent that, involve personnel in the process of acquiring and implementing an analytics tool and defining the goals of the outcome.

From notifications to culture

So, we’re well on our way to translate data into action for our clients. It’s a process of finetuning and learning, every step of the way, in many iterations. It makes smartocto better and smarter, every time you use it. But there’s more. With data translated into easy to understand notifications, it makes data less ‘threatening’, less abstract and easier to talk about. These smart notifications create a common language. They make data and analytics tangible for everyone in the newsroom. There’s no reason why data should be comprehensible for the data ‘nerds’ - and look like absolute gibberish to the rest of us.

Frans Feldberg, professor of Data Driven Business Innovation at Vrije Universiteit Amsterdam, did extensive research on how organisations can create value from data and found that the critical factor in the successful implementation of data tools is “the right mindset among employees from every discipline within the organisation. And this mindset is fed by a common language.”

there's no reason why data should only be comprehensible for data nerds

What he saw was that almost everybody is interested in data, but those in business simply ask different questions to those in IT. According to Feldberg the common language (and yes, we mean notifications) works as a frame of reference around data, analytics and value. It helps to focus the conversation. It steers arguments in the right direction (how does data contribute to our business value? What does this mean in daily practice?) And, of course, it helps to pinpoint the right data sources.

A common language creates a powerful culture within organisations. It binds people from different departments and in different roles. And what you see, says Feldberg, is that people also tend to come together and understand each other better on other subjects too. To trigger this thought process, we ask our clients: What does success look like in this company? And surprisingly (not!) many different answers arise within various departments. The thing is: often the employees don't know. Most of the time there aren't any clear metrics or KPI's that tell them whether or not they're doing well. So, what would your answer to this simple question be?

tip box

Succes in a company is always closely related to the brand and its goals. With our Story Life Cycle approach, we always start with your brand DNA. It helps create clear targets and define a customised toolkit within the smartocto tool.

Grab that holy grail

With smartocto, Gartner’s ‘holy grail’ is well within reach. We help you make data an integral part of business strategy and operations. It’s an ‘end-to-end’ solution that makes data a ‘means’ instead of a goal - not just with actionable notifications, but also with other apps within the tool. To name but a few: Tentacles, our headline testing module or Big screen, giving your newsroom a clear overview of the best performing articles of the day. Very powerful and super convenient!

Data becomes the motor under the hood: not visible to the naked eye, but powerful and noticeable when you hit the right pedals. Smartocto and its smart notifications make data less threatening to the average newsroom employee, which in turn helps to create unity and common ground to meet colleagues from every department. And, isn’t that a great place to be…?

Want to read more from us?

Sign up for our newsletter to receive updates of new blogs.